System Logs
System logs are used to query GatewayRuntime's backend runtime, user operation records, RPC call records (records of external system gateway calls), SQL execution records (database execution records), and security audit records (login and permission records). When troubleshooting, usually first check the backend logs to confirm runtime anomalies, then combine them with operation logs or RPC logs to identify who and when the operation was triggered.
First, look at the terminology
| Terminology | On-site understanding |
|---|---|
| Backend logs | Gateway program runtime logs, Used to check service start-stop, plugin loading, exceptions, and error stacks. |
| Operation Logs | Records of user actions such as adding, editing, deleting, starting/stopping, importing, and exporting on a web page. |
| RPC Logs | Records of external system or protocol entry points initiating write, read, control, and other calls to the gateway. |
| SQL logs | database execution records, used to troubleshoot issues such as import failures, slow queries, and slow exports. |
| Audit Logs | Login, permission, and account security records, suitable for checking who has logged in and whether permissions have been adjusted. |
| Trace / Debug / Info / Warning / Error | log detail. Trace and Debug are the most detailed; after joint debugging, they should be restored to the Info or configured according to on-site requirements. |
Function Entry
After logging into GatewayRuntime Web, click the "System Management → System Logs" menu on the left.
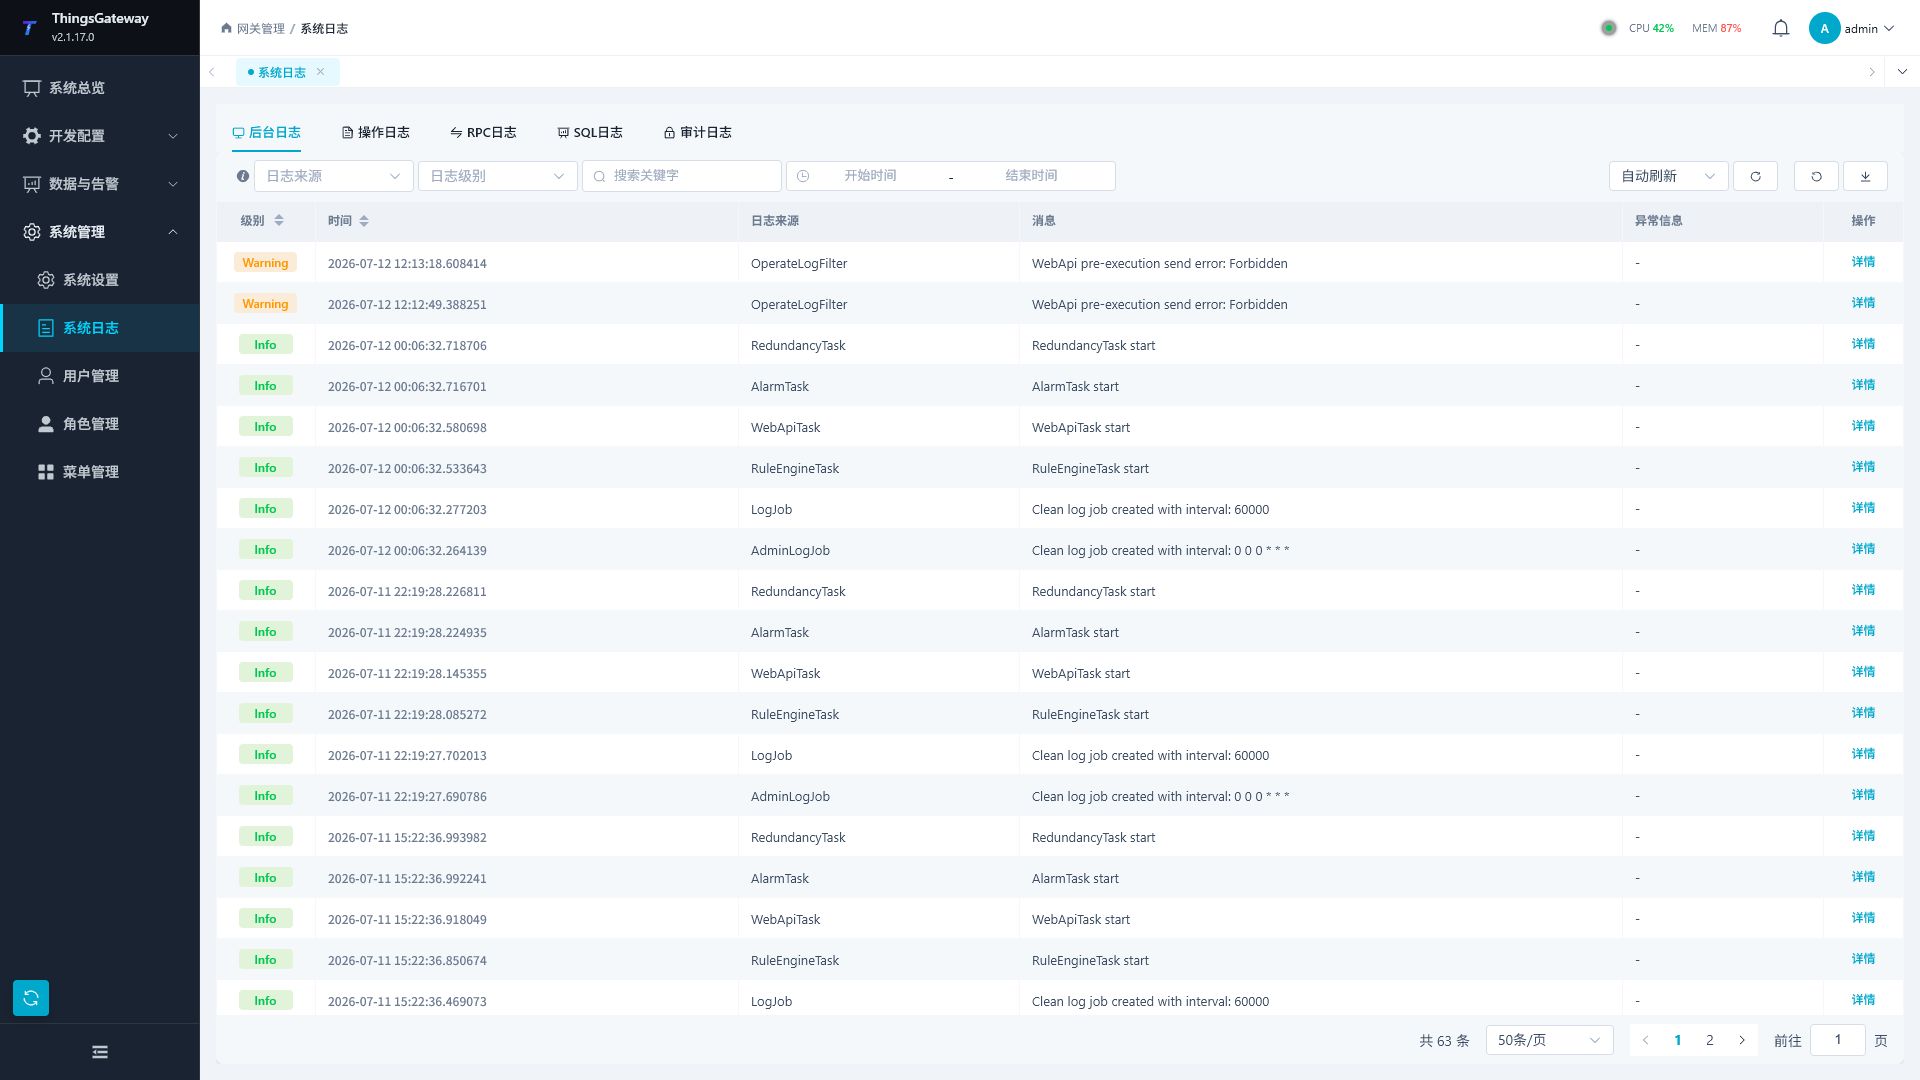
Log Tab
| Tab | Purpose |
|---|---|
| Background Logs | View runtime logs such as service start/stop, plugin loading, running exceptions, and error stacks. |
| Operation Logs | View records of additions, edits, deletions, start-stops, and other operations performed by users on web pages. |
| RPC Logs | View records of write, read, control, and other calls initiated by external systems through interfaces or protocol entries. |
| SQL Logs | View the SQL execution status of the database, execution time, execution results, and error messages. |
| Audit Logs | View login audits, permission audits, and user security audit records; This tab requires audit log permissions. |
Channel and device logs are available from Collection Configuration. Select the device, click More Functions, and open the Channel Log or Device Log tab.
Troubleshooting Order
There are many logs, so it's not recommended to start a global search from the start. First, locate the log type by fault phenomenon, then narrow down the time range.
| Fault Phenomena | Prioritize viewing |
|---|---|
| Offline devices, variable values | Collect channel logs and device logs in configuration, then look at the backend logs. |
| Data not forwarded | The forwarding target logs and group logs on the forwarding page are then checked in the backend. |
| Page operation failure | Operation log, then check the backend log for the same period of anomaly. |
| External system writes failed | RPC logs; if necessary, check device logs and background logs. |
| Login, permission, or account anomalies | Audit logs, operation logs. |
| Database is slow or export fails | SQL logs, background logs. |
Background Logs
Background Logs are used to check the GatewayRuntime itself.
| Operation Items | Description |
|---|---|
| Log Level | By Trace, Debug, Info, Warning, Error, and Critical level filtering. |
| Time Range | Limit the time when the log occurred. |
| Keywords | Search by log content or anomalous information. |
| Query/Reset | Query by condition or restore the default filter conditions. |
| Export | Export logs within the current query range. |
| Automatic Refresh | Continuously update the log list according to the refresh interval provided by the page. |
| Details | Open the log details to view the full log content and anomalies. |
| column | Explanation |
|---|---|
| time | log occurrence time. |
| Level | Log Level. |
| Source | Log source. |
| Log Content | Log Messages. |
| Exception information | Details of the exception stack or error. |
Operation Log
Operation log is used to track business operations performed by users on web pages.
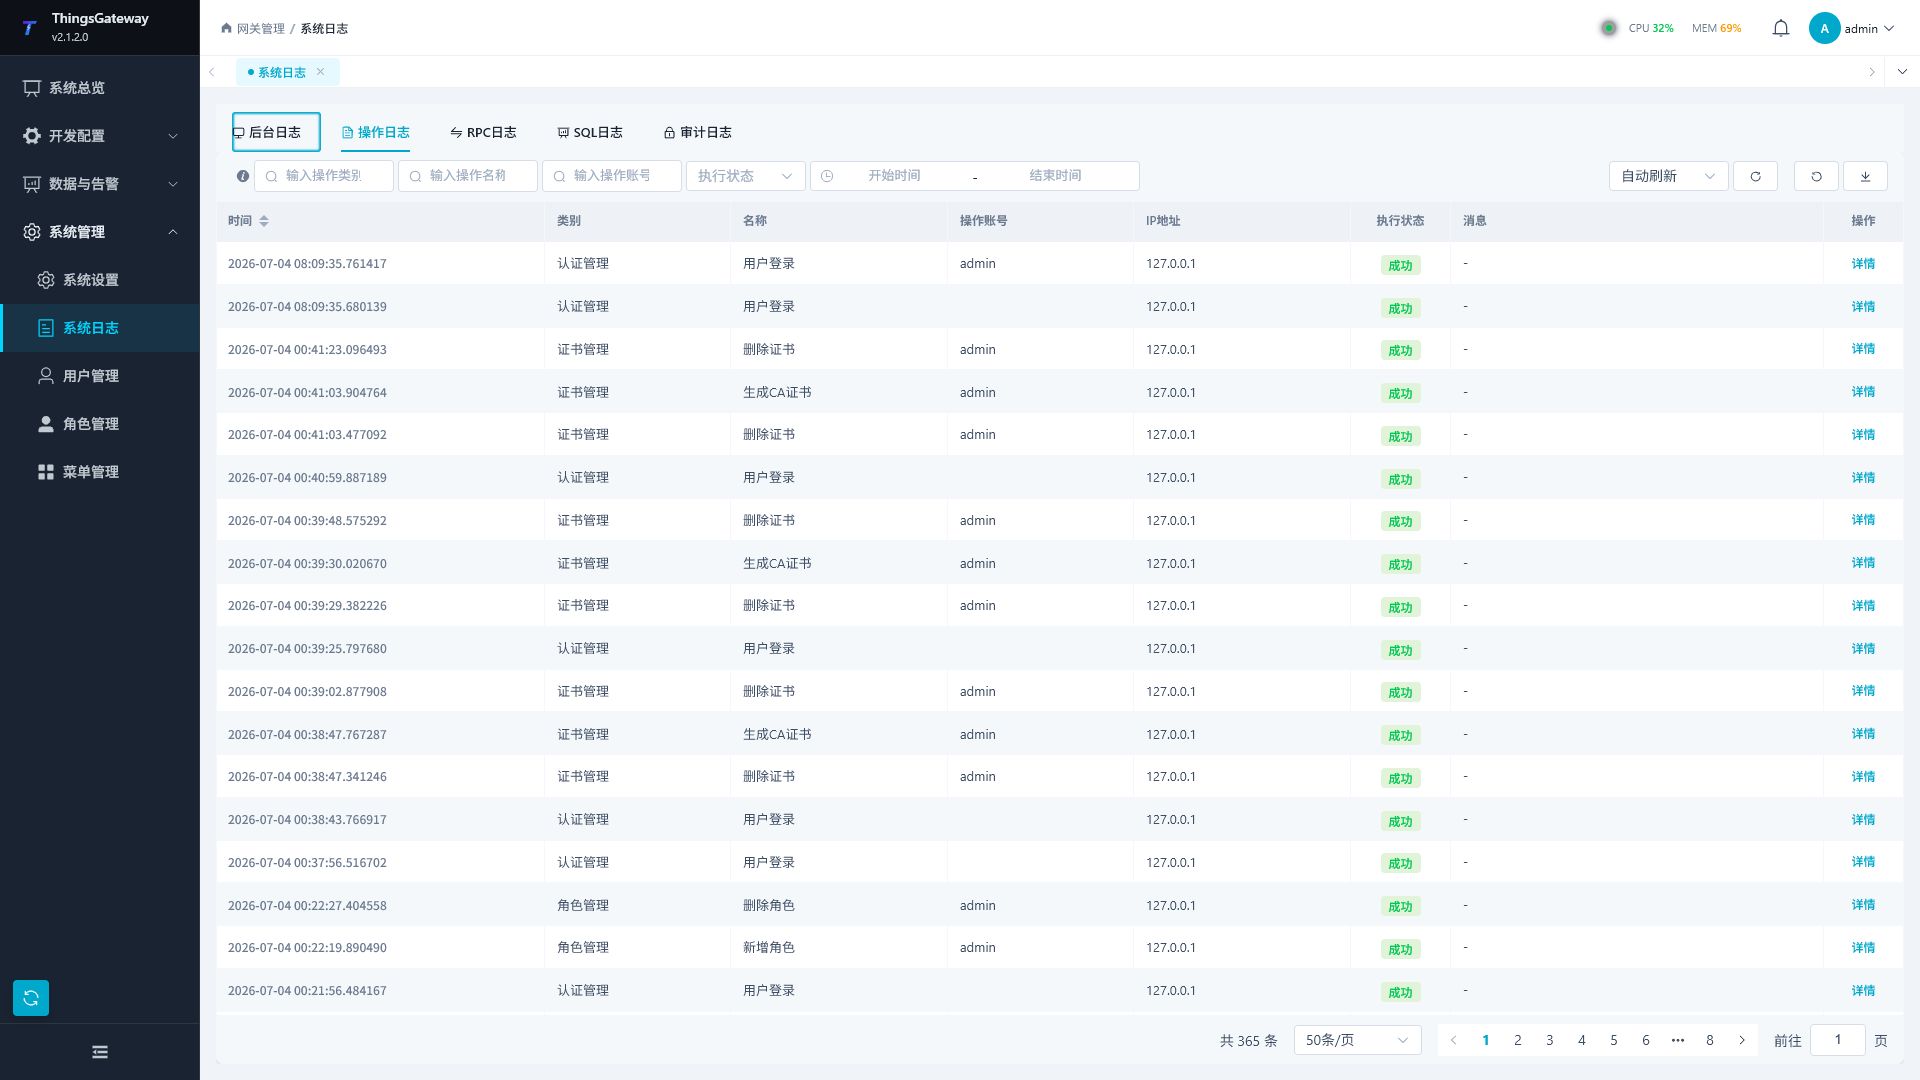
| Filter Items | Description |
|---|---|
| Operation Categories | Filter by function category, such as configuration, permissions, operation control, etc. |
| Operation Name | Filter by specific operation name. |
| Operating Accounts | Filter by the login account that performs the operation. |
| Run Status | Filter for success or failure records. |
| Time Range | Limit the time when operations occur. |
| column | Description: |
|---|---|
| time | operation occurrence time. |
| Category / Name | The category to which the operation belongs and the operation name. |
| Method | Name of the method called by the operation. |
| Operating Account | User performing the operation. |
| IP address | user's access source address. |
| Status | Operation successful or failed. |
| Message | Explanation of operation results. |
Click "Details" to view the request method, address, parameters, processing results, and error messages. For issues involving account, permission, or configuration adjustments, the details of the operation log should be saved first.
RPC Log
RPC log is used to view calls initiated by external systems to the gateway.
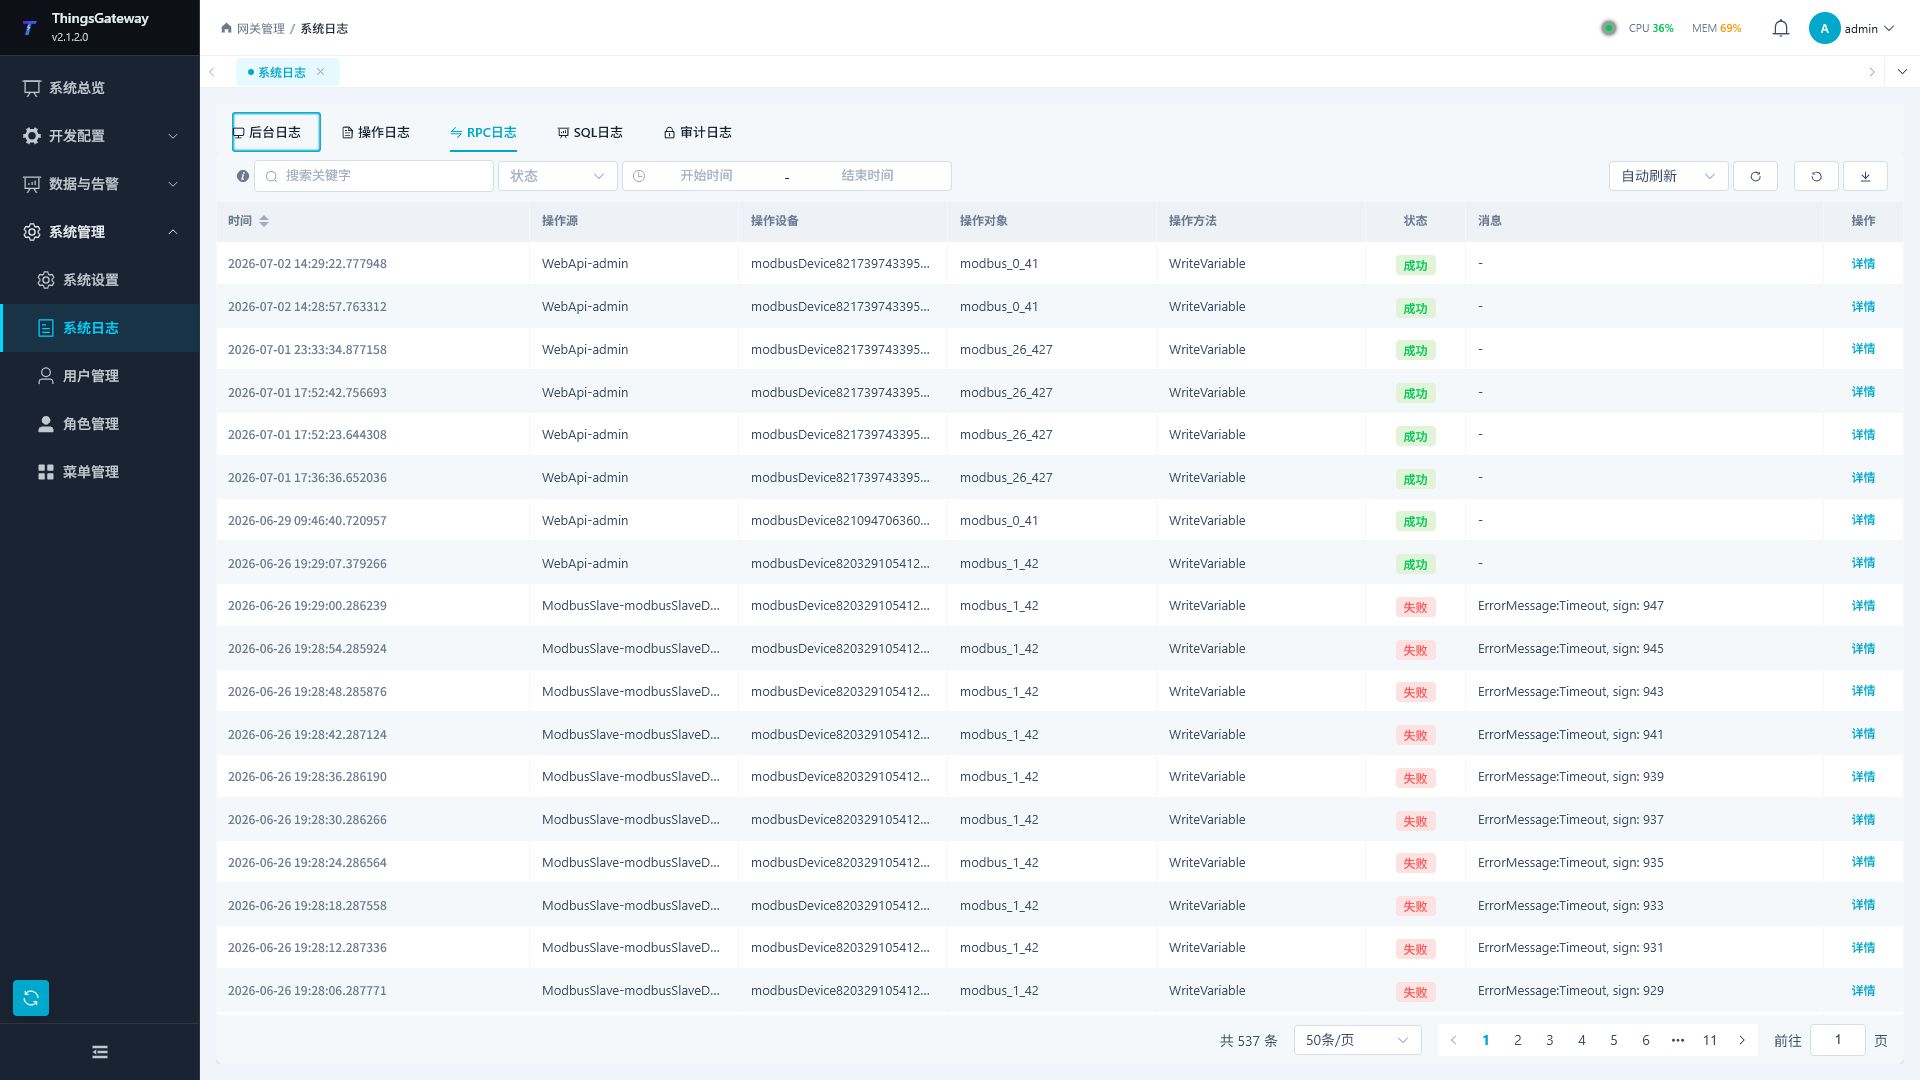
| Filter | Description |
|---|---|
| Search keywords | Search by call source, device, object, method, or message. |
| Status | Filter for successful or failed calls. |
| Time Range | Limit call times. |
| column | Explain the |
|---|---|
| time | the time the call occurred. |
| Source of Operations | Source of call, such as external systems, protocol entry, or interface callers. |
| Operate the device | Call the associated device. |
| Operation Object | The Object being Invoked. |
| Operation Methods | Write, read, or other calling methods. |
| State | Whether the call was successful. |
| Message | Invocation result or failure reason. |
SQL Logs
SQL logs are used to troubleshoot database access issues and slow queries.
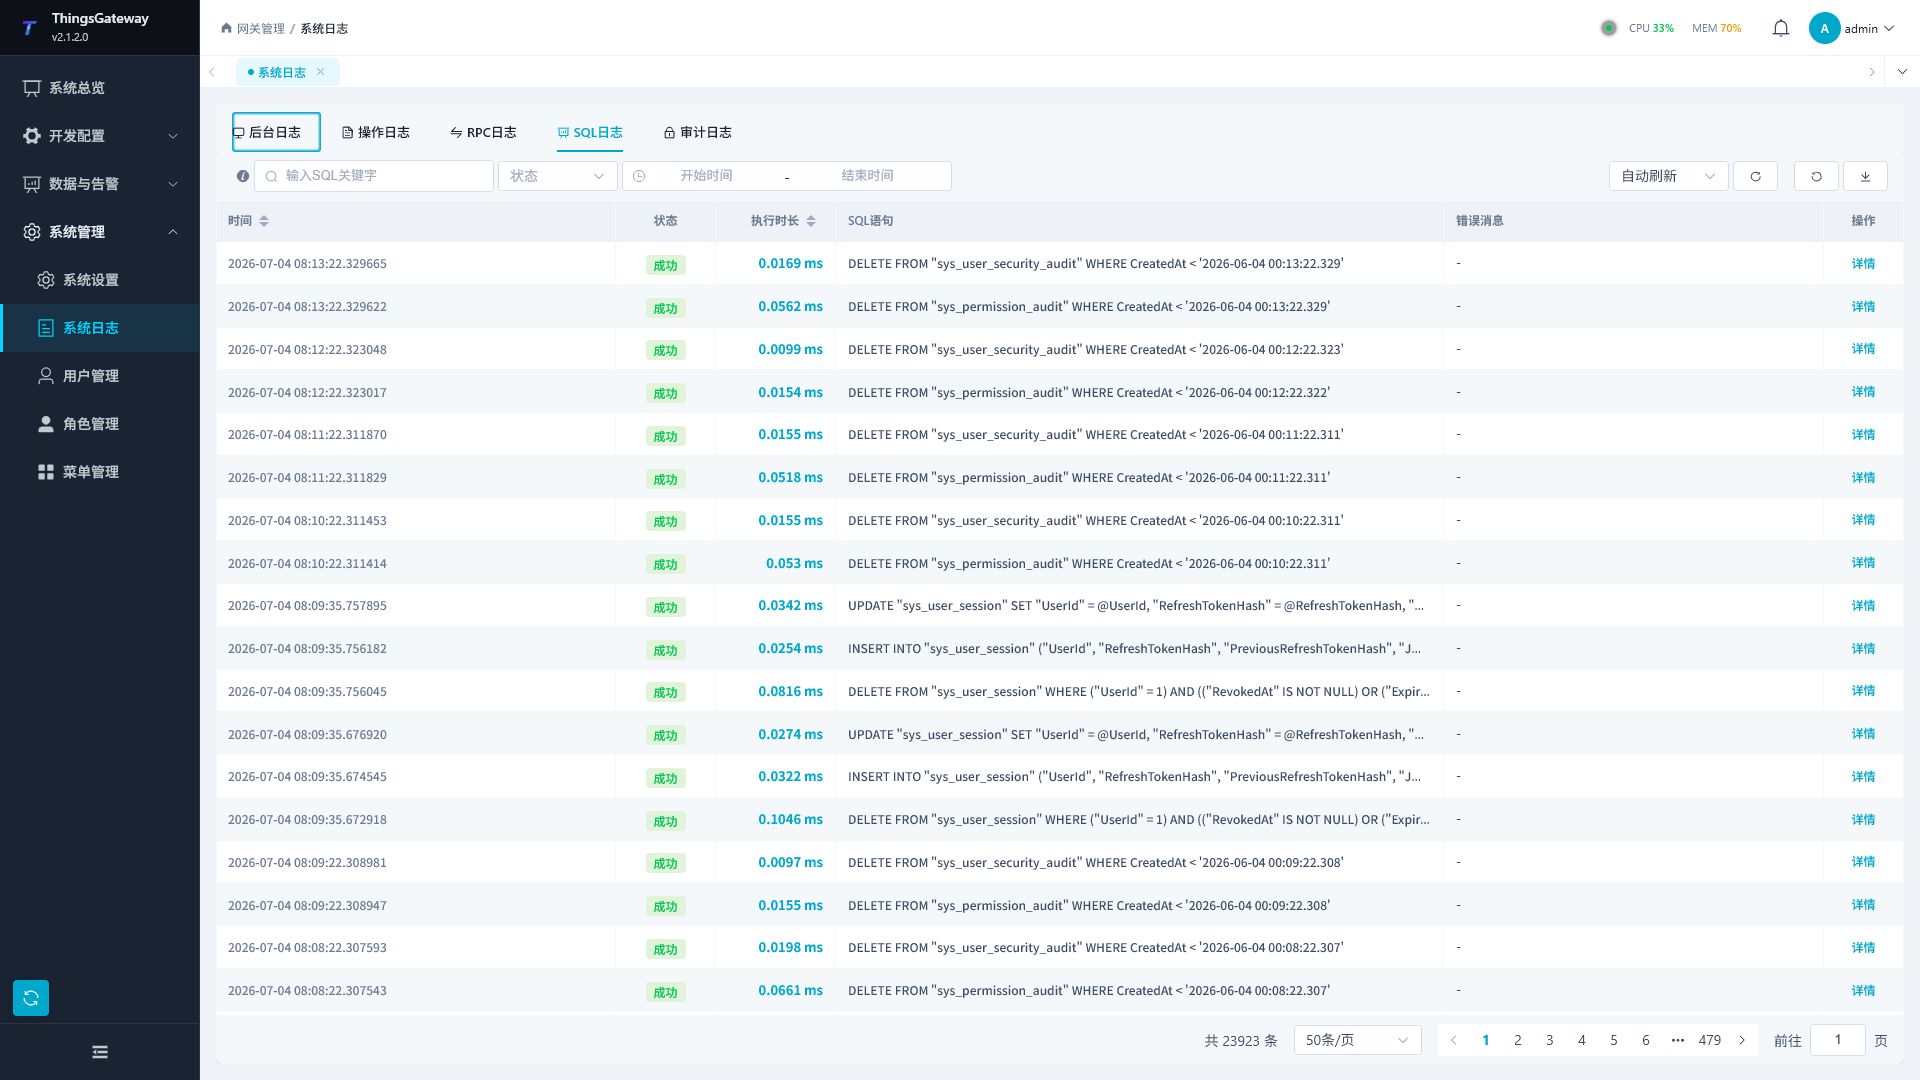
| Filter Items | Description |
|---|---|
| SQL Keywords | Search by SQL Statement Content. |
| Status | Filter successful or failed SQL files. |
| Time Range | Limit SQL execution time. |
| column | Describes |
|---|---|
| time | SQL execution time. |
| Status | Execution successful or failed. |
| Execution Duration | SQL execution time is time. |
| SQL statements | executed SQL content. |
| Error messages | Error explanations on failure. |
Click "Details" to view SQL parameters, execution time, number of affected rows, database configuration, and complete error messages.
Audit Logs
Audit logs are used to track logins, permission adjustments, and user security events.
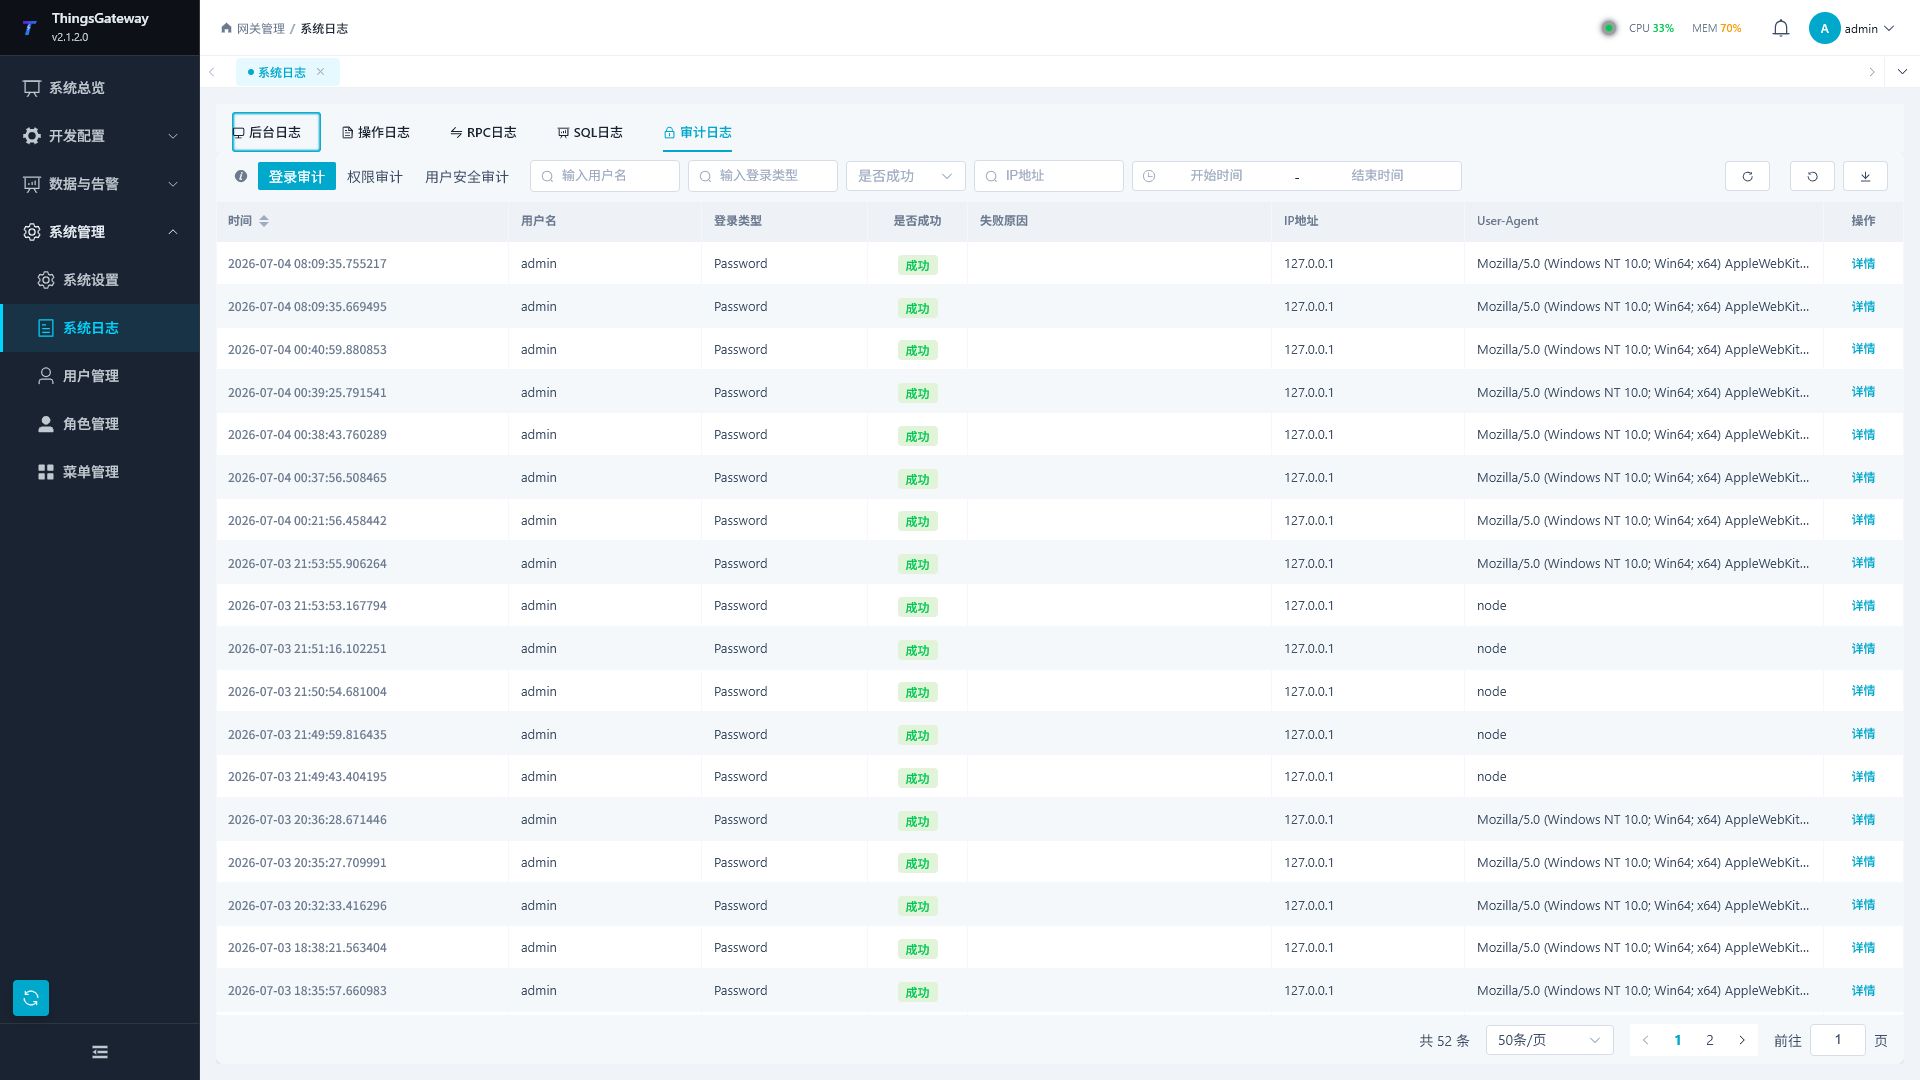
| Audit Type | Description |
|---|---|
| Login Audit | Query login username, login type, success status, failure reason, IP address, and User-Agent. |
| Permission Auditing | Query role permission changes, including before, after, and operator changes. |
| User Security Audit | Query security actions related to user locking, unlocking, session revocation, and passwords. |
Troubleshooting Recommendations
| Phenomena | Recommendations to Check |
|---|---|
| Page Operation Failures | First check the failure message in the operation log, then check if the backend log has an exception stack. |
| External system write failure | Review RPC logs to confirm the source of operations, target devices, methods, and cause of failure. |
| Slow database response | Check the execution duration of SQL logs and SQL statements. |
| Account Abnormal Login | View Login Audit and User Security Audit in the Audit Log. |
Related Links
- System Overview - System Status Monitoring
- Collection Configuration - View Channel Logs and Device Logs
- System Settings - Gateway System Configuration