Collection Debugging and Troubleshooting
Identify the affected device and point, then inspect transport, protocol, and value processing. Change one condition at a time and record the original configuration.
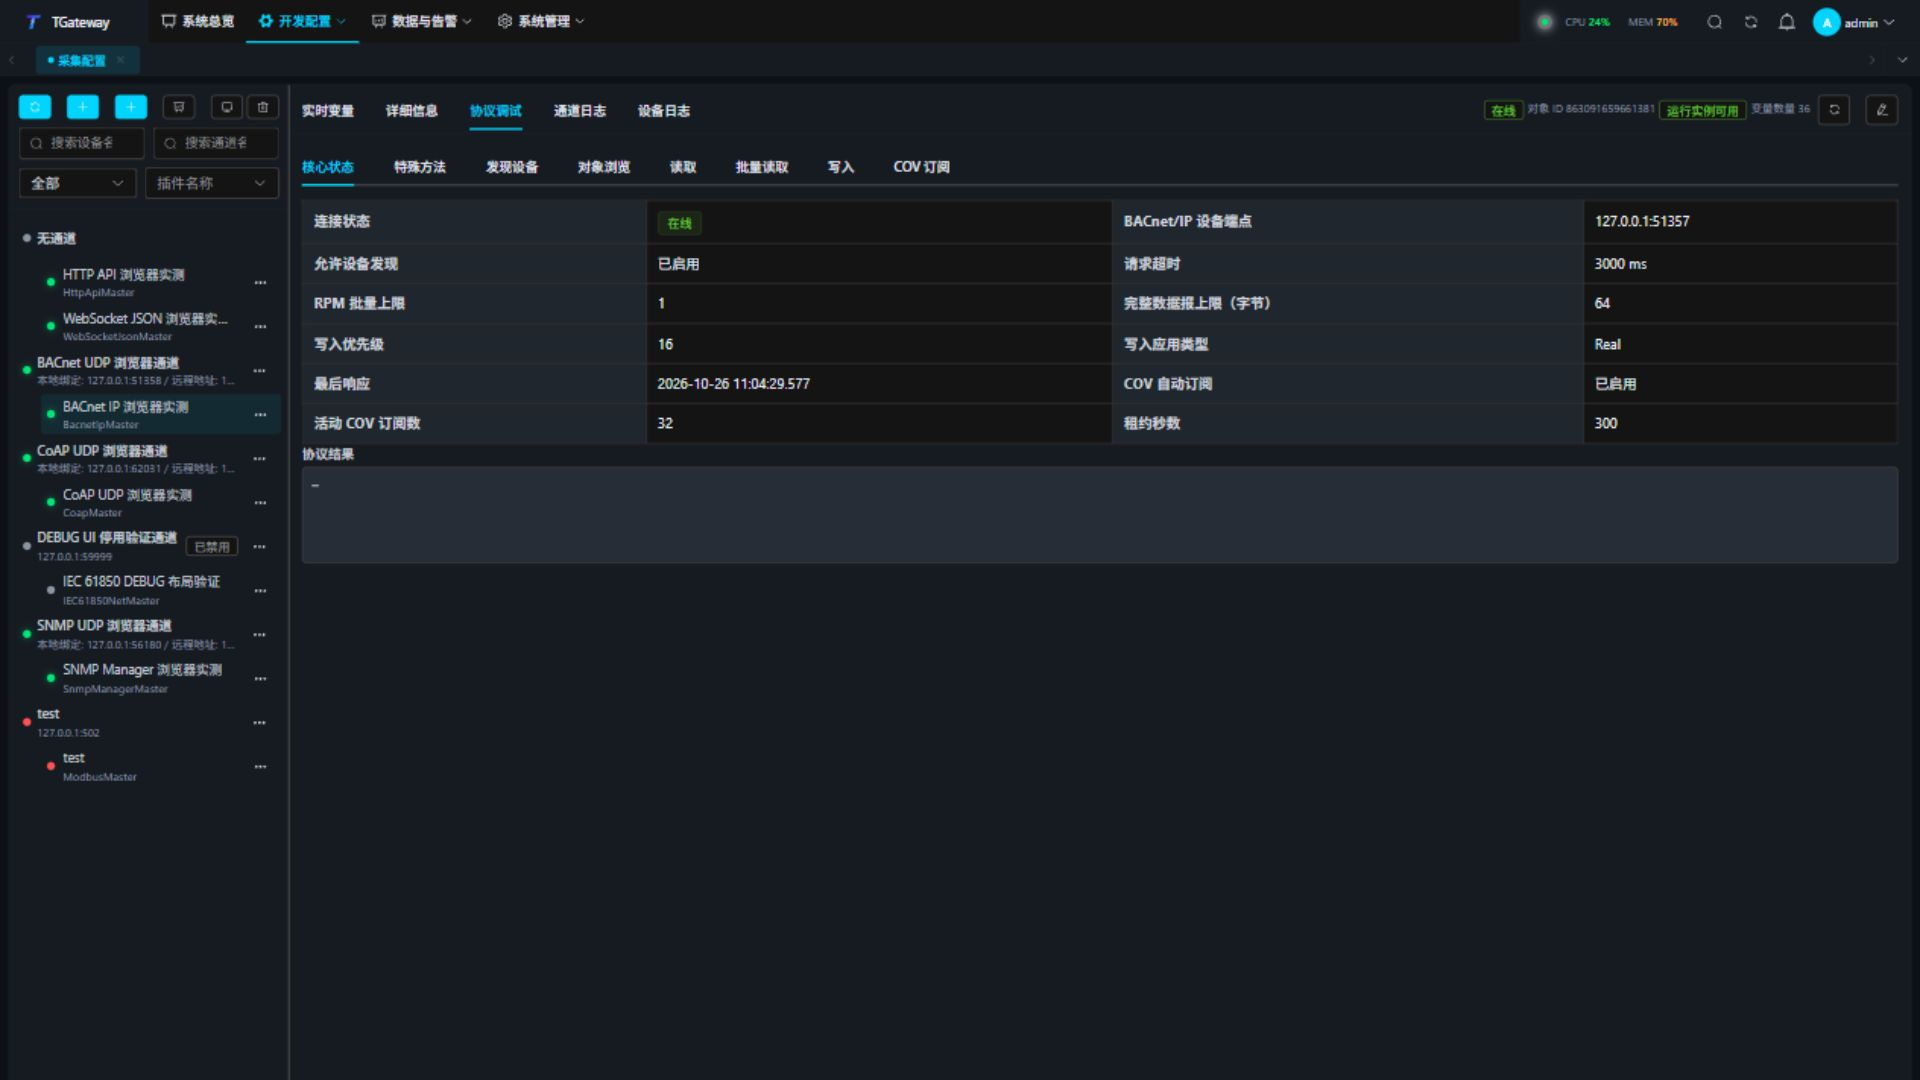
Open Development Configuration → Collection Configuration, select the device, and choose the top Protocol Debug tab. Plugins with a dedicated Core status tab place Special methods immediately after it; other plugins provide special methods and their existing operations directly. Methods and protocol capabilities share one tab row. View general runtime counters under Details. Live variables, details, and channel/device logs share the same workspace.
Use Refresh at the top of the workspace to update protocol connection and runtime summaries. It preserves the selected protocol tab, input drafts, and the latest operation result.
Discovery results, subscriptions, notifications, and other dynamic diagnostic lists provide page and page-size controls. Automatic status updates retain the current page. If records are removed, an invalid page moves to the last available page. Lists such as object browsing retrieve only the selected page. Display pagination does not change protocol batch counts, block sizes, or message byte limits configured for the device.
Locate the failing layer
Read the variable state
| Information | Use |
|---|---|
| Current value | Business value after read expressions and decimal handling. |
| Raw value | Source value after protocol reading and type interpretation; helps separate transport and expression problems. |
| Collection time | Latest sample time. Check it or source requests even when the source value is fixed. |
| Change time | Time the value changed. A stable value does not establish stopped collection. |
| Online quality | Current quality, interpreted with timestamps and errors. |
| Source/business errors | Distinguish communication and parsing from expressions or other processing. |
Use column settings for addresses, types, permissions, expressions, and errors. Filters and pagination limit the visible set; an empty result does not establish that a variable is absent from the project.
Diagnose by layer
| Layer | Checks |
|---|---|
| Configuration | Channel, device, and variable enabled; correct plugin and channel reference. |
| Network or serial | Direction, endpoints, port ownership, firewall, and TLS handshake. |
| Protocol session | Station number, protocol mode, S7 rack/slot, OPC UA identity, and related options. |
| Address and type | One known-readable point; area, offset, type, length, and byte order. |
| Value processing | If raw data is correct, check read expressions, arguments, units, and decimal handling. |
| Forwarding/storage | If collection works, inspect forwarding scope, triggers, and target logs. |
Distinguish common failures
Wrong endpoint
Channel logs often show connection failure before device read errors. Confirm the source still listens. Restore the original endpoint and check the same variable's new sample and recovered quality.
Correct endpoint, stopped source
Check service state, power, and an independent client. Restart the original source and verify automatic reconnection with the unchanged configuration.
Connection succeeds, address is out of range
When another point works on the same device, inspect the failing address and protocol exception. For a source strictly exposing 16 holding registers, offsets are 0–15: 40001 is valid while 40033 refers to offset 32. An independent read of the valid point helps distinguish an address rejection from a network failure. Actual rejection depends on source range enforcement.
Interpret Connected, Closed, and dispose logs together with errors; a close can be part of configuration reconstruction. If several devices on a shared channel fail together, check their common transport first.
Use debugging tools
Use protocol tools
- Verify device, plugin, channel, and runtime state in Details.
- Open Protocol Debug. When the plugin provides a dedicated Core status tab, it comes first, followed by Special methods; then use the operation, read, or model browser tab for the same test point. Method parameters remain editable while the runtime is stopped; communication commands become available when it is running.
- Compare returned value and type with the source; inspect specific errors.
- Match requests and responses in the current capture window.
A successful debug read establishes that request's result. Normal collection still requires correct variable configuration, scheduling, and continuous new samples. See Modbus, S7, OPC UA, and Custom Full Packet.
Runtime statistics
Match name, plugin, identity, channel/group, and redundancy role before comparing consecutive snapshots. An empty role is normal without redundancy.
| Information | Interpretation |
|---|---|
| Instance type, start, initialization | Driver lifecycle; separate from point quality. |
| Cumulative successes/failures | Compare increments from the same instance. Reconstruction can reset counters. |
| Maximum count per second | Peak under that counter's definition, not every variable's update rate. |
| Last activity/success/failure | Different timestamps that may be empty or differ; browser refresh time is not a substitute. |
| Bytes sent/received | Include protocol overhead; do not derive variable throughput directly. |
| Latest duration | Milliseconds for the last operation, not an average. Unavailable statistics are not zero. |
Single, array, and batch operations
Single mode uses a start address, type, and read count. Count 1 means one element and 3 means three consecutive elements. This differs from collection configuration where array length 0 denotes a scalar.
Batch mode accepts one address per line, removes whitespace and duplicates, and allows up to 100 distinct addresses. Type and count apply to each address. This debug limit is separate from continuous collection packing. Batch writes use an address-to-value JSON object:
{"40011":80,"40012":5}
Check the confirmation's objects and count; cancel sends no write. Review every row afterward. Clearing operation history only clears the display and does not undo field writes.
Type widths and precision
| Type | Check |
|---|---|
| Boolean, Byte | Bit and byte addressing differ. A Modbus register has two bytes; do not infer byte selection from a suffix alone. |
| Int16, UInt16 | 2 bytes; signed and unsigned interpretations can differ. |
| Int32, UInt32, Float | 4 bytes; floating encoding is different from integer scaling. |
| Int64, UInt64, Double | 8 bytes. Check large integers through the raw interface and consumer precision. |
| Decimal | 16 bytes; source layout must match the converter. It is not a universal PLC decimal format. |
| String | Specify byte length and encoding. String byte length and array element count are separate. |
Keep source bytes fixed when comparing interpretations, then restore the original address, type, and count.
Verify writes
- Use a permitted test point and check read/write access, RPC enablement, and protocol permissions.
- Record the original value and submit a correctly typed value.
- Check the result and RPC logs.
- Wait for collection feedback and confirm through the source or an independent protocol client.
- Restore the test value and normal state.
Write acknowledgement, displayed values, and physical execution require separate checks. Verify read and write conversions together so engineering values are not confused with raw register values.
Logs and recovery
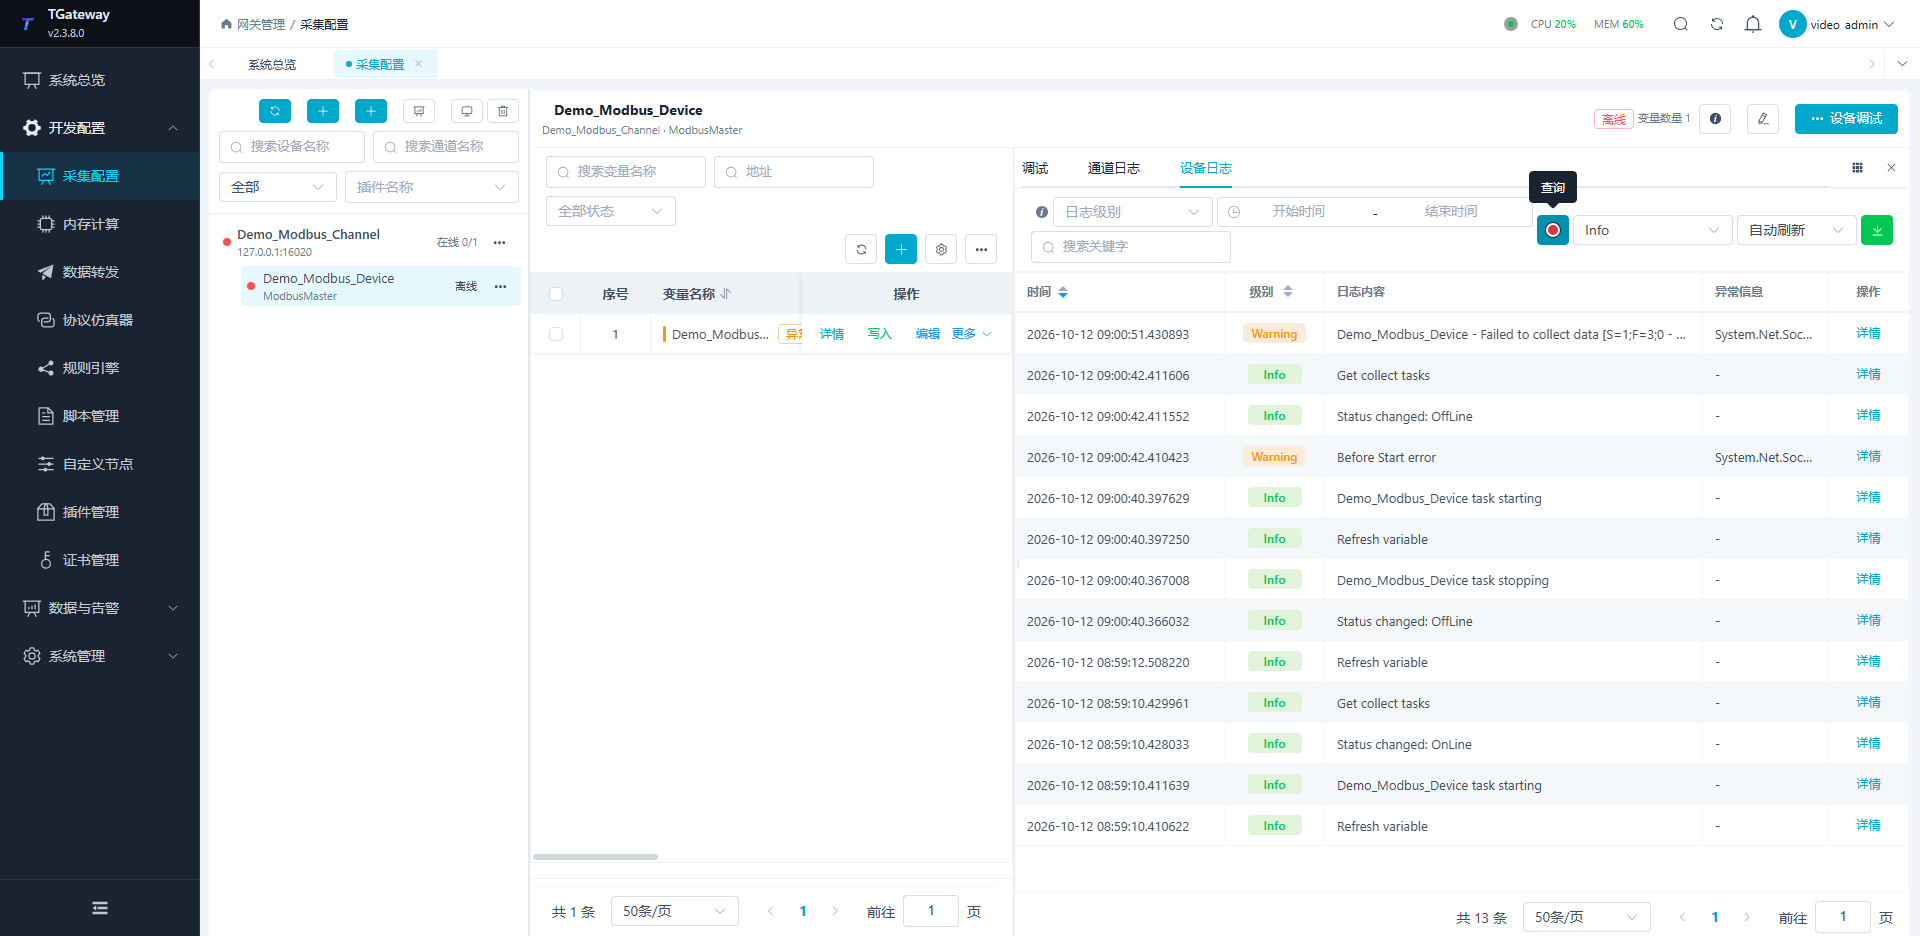
Temporarily use Debug or Trace and restrict the time window to this operation. Device log level controls what is recorded; query level only filters existing records. Keyword, time, order, pagination, export, and refresh settings do not change PLC sampling.
Start temporary message capture explicitly. Clearing it only clears the list; new messages may continue to arrive. Stopping capture or leaving releases the observation session without stopping collection or deleting persistent logs.
Directly invoke a device or forwarding-target method
No variable is required. First enable Allow method calls in the called device or target's basic configuration and save. Debug and rule special-method calls also check this switch. See Plugin Method Calls. For forwarding targets:
- Open Development Configuration → Data Forwarding, select the target, and open its debug workspace. Confirm the target, plugin, group, and runtime instance.
- Open Special Methods, refresh the catalog, and select a listed operation. Refreshing does not execute it.
- Follow the signature and pass arguments as an outer JSON array. For an upload method, the topic is a string; a byte payload can be Base64 text or a nested numeric byte array, rather than ordinary body text.
- Check both the request and method business result, then verify the exact topic and new body at an independent receiver. Empty content can be a valid successful result; outer-request success alone is insufficient.
Devices use the same Special Methods module in their own workspace. Method selection, parameter editing, and directory refresh are disabled while a call is pending. Changing parameters clears the previous result. A confirmed success with a diagnostic displays both; missing content alone is not a reason to repeat a command.
Invalid JSON should not invoke the method. Clearing the display does not undo sent messages or change the normal forwarding group interval and variable routes.
Restore configuration, log level, source state, quotas, and test values. Preserve the original objects and verify two consecutive windows of new samples. Recreating objects does not establish recovery of the original configuration. See Collection Configuration and Channel Transport.