System Overview
The system overview page displays the gateway's operating status, system resources, engineering information, and trend charts, serving as the core entry point for daily inspections. Statistics and resource information at the top of the page will refresh automatically, or manually refresh via the floating menu in the upper right corner.
First Look at Terms
| Terms | On-site Understanding |
|---|---|
| Channels | Communication links from gateways to field devices, such as a TCP connection, a serial port, or a listening port. |
| Device | a PLC, instrument, acquisition module, or a logic acquisition object managed by plugins. |
| Variable | A point in the point list, such as temperature, pressure, operating status, fault state, or control write point. |
| Real-time alarms | Alarm events that still require personnel attention do not mean the on-site fault has been resolved. |
| CPU/memory/disk | gateway host resources. If the data remains high for a long time, prioritize checking collection frequency, forwarding cache, rule flow, and log volume. |
| Widget | Draggable information blocks on the overview page, such as resource monitoring, engineering information, or trend charts. |
Page Entry
After logging into the system, the system overview page is displayed by default, or you can click the "System Overview" menu on the left to enter.
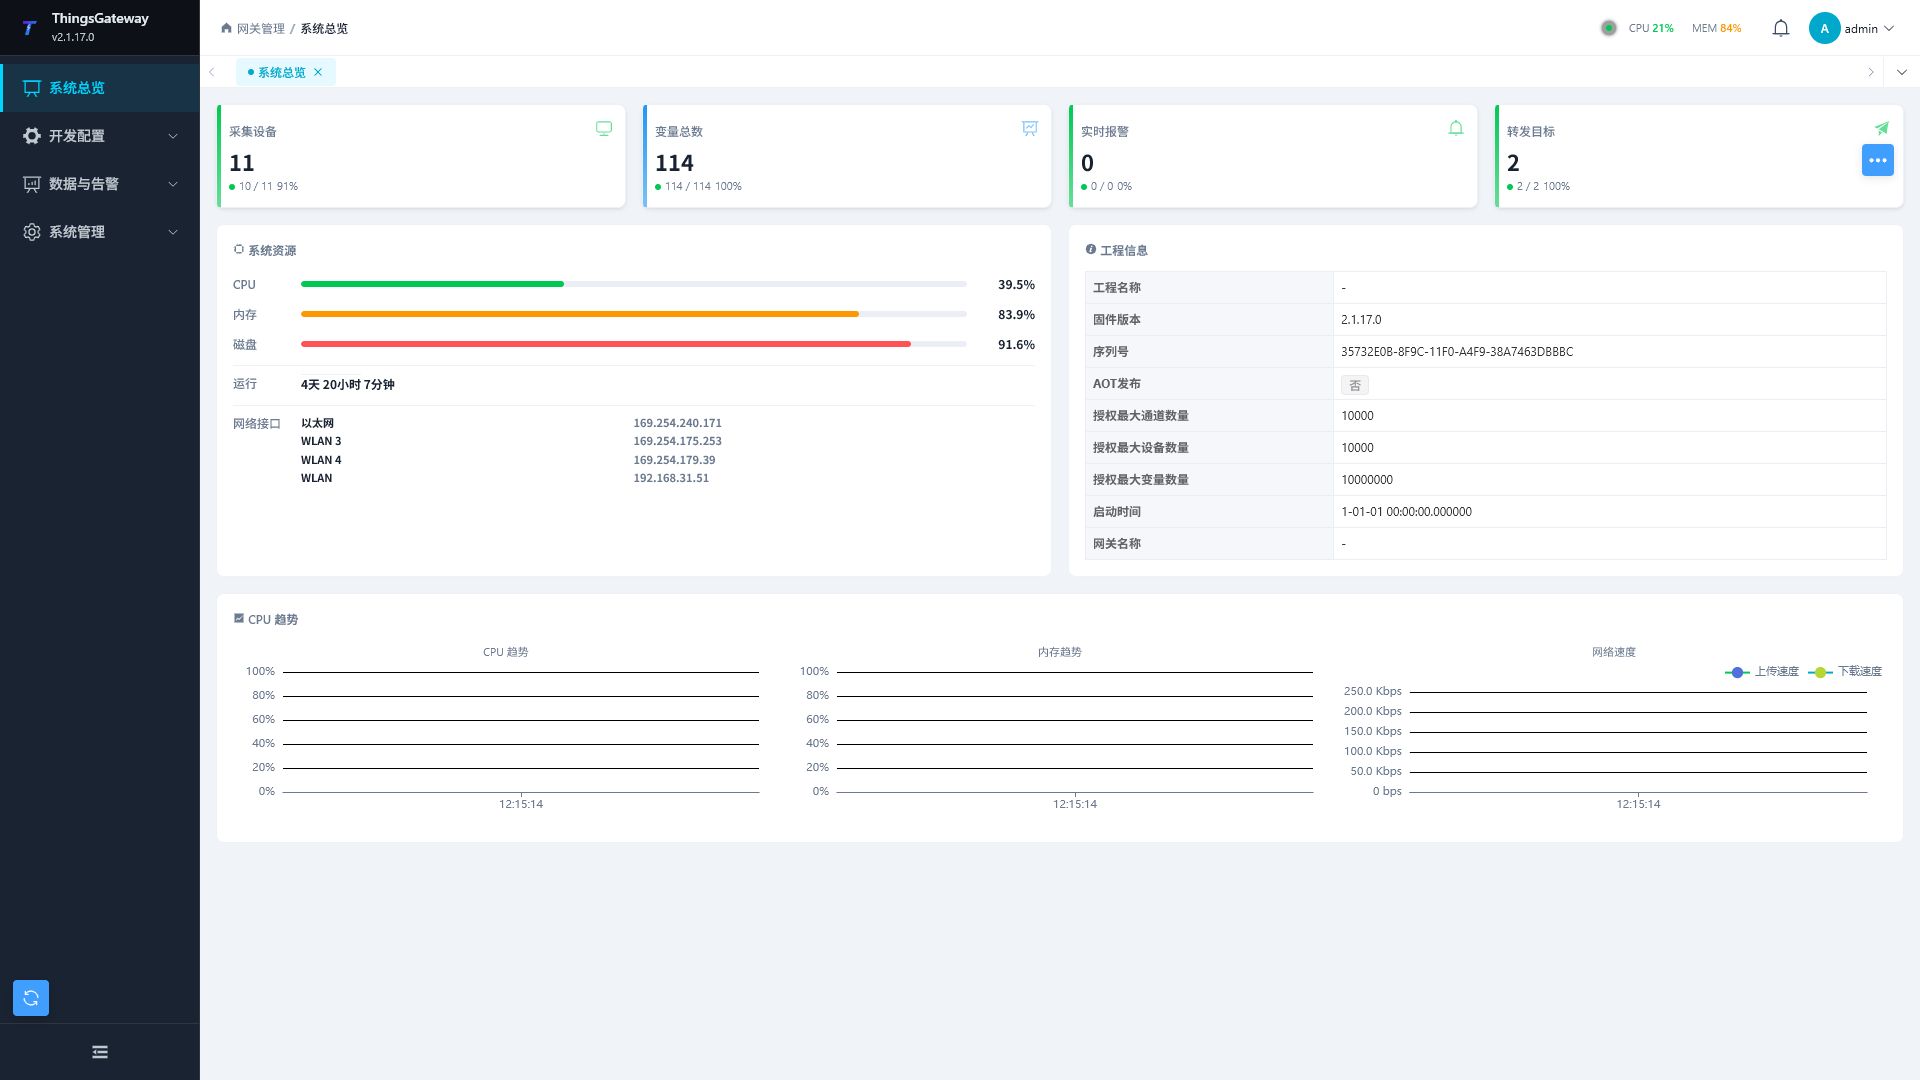
Statistics Card
| Card | Description |
|---|---|
| Total Number of Channels | Displays the total number of channels and indicates the number of channels enabled. |
| Total Number of Devices | Displays the total number of devices and indicates the number of online devices. |
| Total number of variables | Displays the total number of variables and indicates the number of normal variables. |
| Real-time Alarm | Displays the current number of real-time alarm variables and indicates the number of alarm events. |
Statistical cards are suitable for quickly determining whether the project is fully loaded. If abnormalities are found in the number of device online counts, normal variable counts, or real-time alarm counts, then proceed to "Collection Configuration," "Real-time Alarms," or "System Logs" to view details.
System Resource Monitoring
| Metrics | Description |
|---|---|
| CPU Usage | System CPU Usage Percentage. If the rate remains high, prioritize high-frequency collection, rule processes, and data forwarding. |
| Memory usage | System memory usage percentage. If persistently high, check the number of variables, cache queues, and runlogs. |
| Disk Usage | Current disk usage percentage. Insufficient disk space can affect historical data, cache files, and log writing. |
| System Runtime | Runtime after GatewayRuntime starts. |
| Network Interface | displays the network card name and IP address to confirm the current access address and on-site network configuration. |
- When CPU or memory remains high for a long time, first lower the debug log level, then check the collection frequency, rule flow, and forwarding target cache.
- When disk usage approaches the upper limit, promptly clear unnecessary logs, backups, and offline caches to prevent data write failures.
- The network interface list helps confirm the IP addresses actually used by the gateway. Before modifying the network card configuration, you should prepare backup connection methods.
Trend Chart
Trend chart shows recent changes in CPU, memory, and network up/downlink speeds. System resources and trend data are refreshed on a short-term basis, while top statistics are refreshed on longer periods; If you need to update immediately, tap "Refresh" in the floating menu at the top right.
| Chart | Explanation |
|---|---|
| CPU Trends | View CPU Usage Changes, Used to determine whether there is a sustained high load. |
| Memory Trends | View changes in memory usage to determine if there is sustained growth. |
| Network Speed | View upload and download speeds, used to assess data forwarding or changes in external access traffic. |
Page Layout
Click "Edit Layout" in the floating menu at the top right to adjust the widget layout of the overview page.
| Operation | Description |
|---|---|
| Edit Layout | Enter layout editing mode, where you can drag system resources, Widgets for engineering information, trend charts, and more. |
| Save Layout | Save the overview layout in the current browser. |
| Add Widget | Re-add Widgets that are already hidden. |
| Delete Widgets | Remove widgets that do not need to be displayed while edited. |
Save the layout to the current browser. After changing browsers or clearing browser data, you need to rearrange the layout.
Project Information
Project Information Displays basic information about the currently operating project:
| Information | Description |
|---|---|
| Project Name | The currently loaded project name. |
| Firmware Version | GatewayRuntime Version Number. |
| Serial Number | Gateway serial number or UUID. |
| AOT release | Whether it is an AOT release package. AOT packages can usually run independently, but plugin compatibility must be confirmed before release. |
| Maximum number of channels authorized | Maximum number of channels currently authorized for authorization. |
| Maximum number of authorized devices | Maximum number of devices currently allowed by the authorization. |
| Maximum number of authorized variables | Maximum number of variables currently allowed by authorization. |
| Start Time | The time related to the current project creation or start. |
| Gateway Name | Project Description or Gateway Identification Information. |
If project information is empty or shows abnormal, first confirm whether the current user has permission to view project information, then check whether GatewayRuntime loads the project correctly.
Related Links
- Collection Configuration - Channel, Device, Variable Configuration
- Real-Time Alarm - Alarm Monitoring and Handling
- System Settings - Gateway System Configuration