Scale Verification and Capacity Planning
Confirm collection and connections with five devices before increasing the load in an isolated test project. Capacity depends on the protocol, points, scan periods, and downstream work; validate your own configuration.
Follow the four steps below, or go directly to the single-run results for 1000 devices and one million variables.
1. Establish a five-device baseline
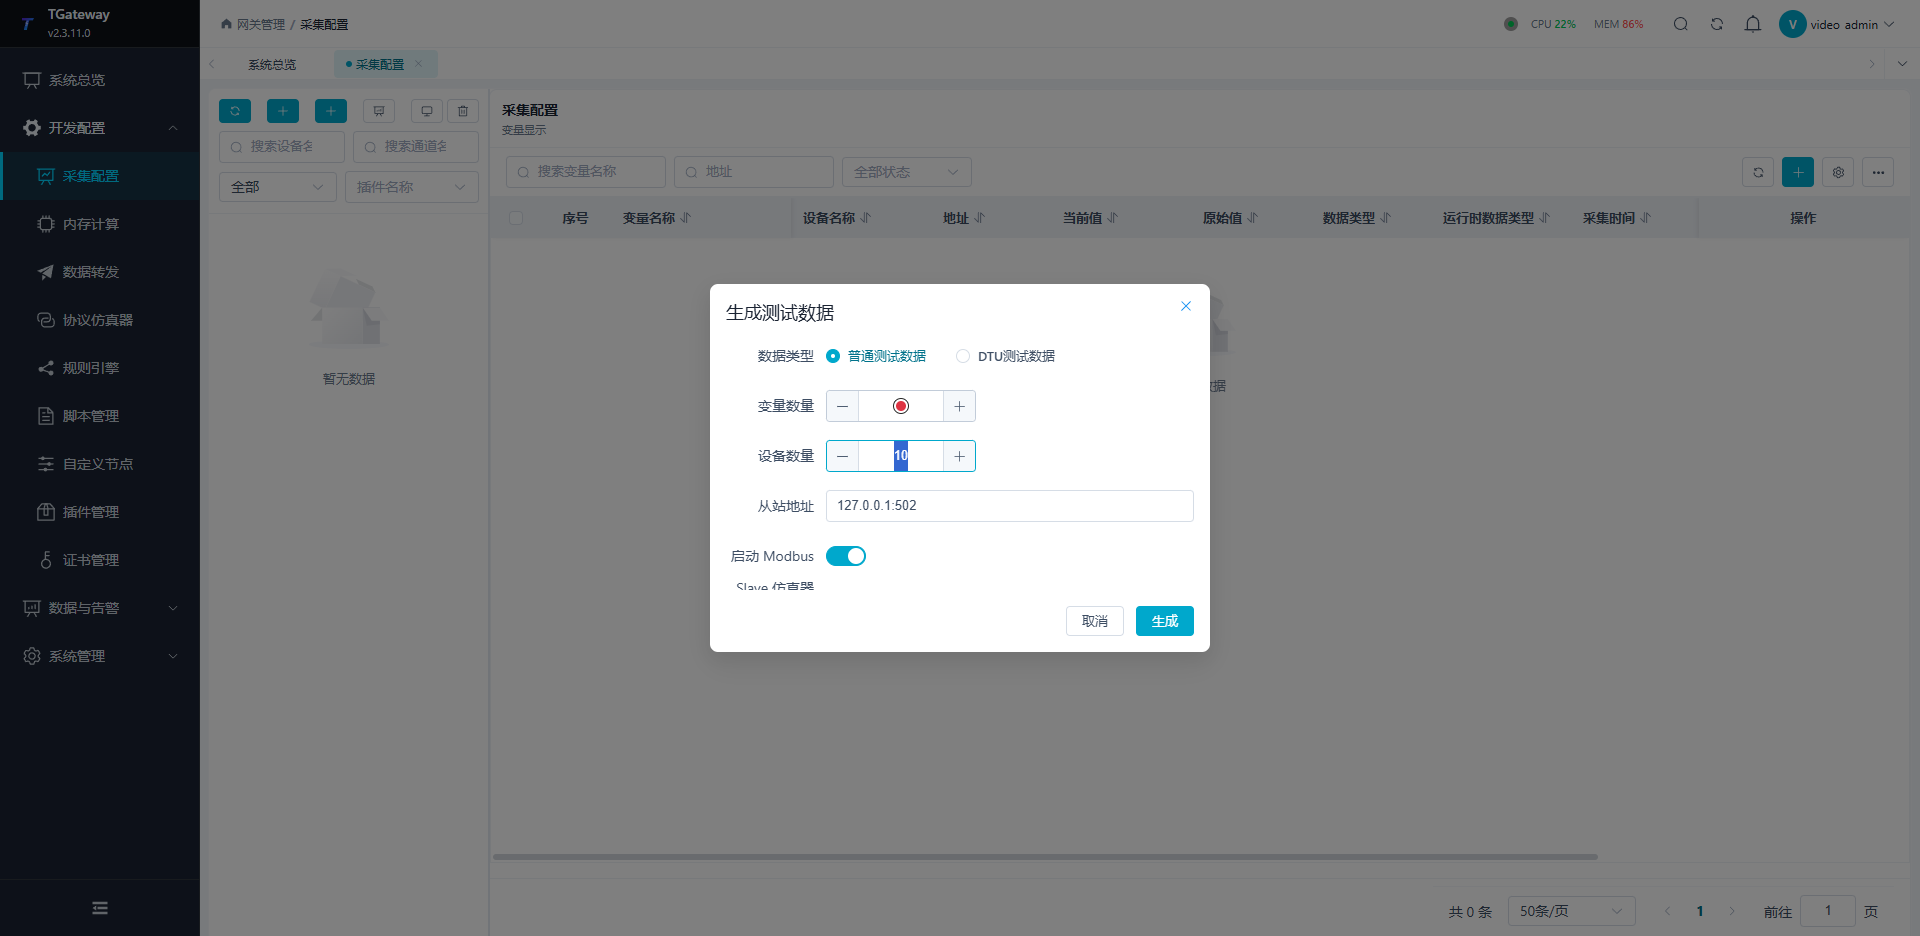
Open Development Configuration → Collection Configuration → More in the variable toolbar → Test Data, then select Ordinary Test Data. Use an isolated project. Generation appends objects; submitting again does not replace the previous batch.
- Generate 2 devices and 20 variables with Start Modbus Slave Simulator disabled. Without an existing source, configuration is created but collection stays offline.
- At the same endpoint, append 3 devices and 30 variables, this time enabling the built-in simulator. Verify a total of 5 channels, 5 devices, and 50 variables.
- Wait for five source clients. Check that every device is online and its success count increases. Zero can be a valid source value; also check quality and new sample times.
- Stop the same source. Verify that connections close, devices go offline, and configuration remains. Restart it and check recovery of the same objects with new samples.
Pass condition: all five devices produce new samples and success increments, and retain their identities through recovery. A successful save or green status on the first page is insufficient.
Test-data fields and variable allocation
| Parameter | How to fill it in |
|---|---|
| Variable count | Total for the whole batch, rather than the count for each device. |
| Device count | New logical devices. Each receives a separate TCP client channel. |
| Slave address | Actual Modbus source endpoint, rather than the Runtime Web address. |
| Start Modbus Slave Simulator | Enables the built-in source. When disabled, configuration is still created and requires an existing source. |
20 variables and 2 devices normally give each device 10 points. The last device takes any remainder. If devices outnumber variables, the actual variable total is increased to cover the devices. Prefer divisible combinations for scale tests.
After an error, check how many objects were created before submitting again. Confirm license capacity, port ownership, and source connection quotas before increasing the load.
2. Check connection quotas
Maximum Clients limits the entire source instance. Clients Per IP limits one origin and cannot exceed the total. When logical devices share a local source, both limits must cover the planned connections and leave maintenance headroom.
Stop the source, edit and save its limits, reopen to verify them, then start it again. A local thousand-connection test can explicitly set both limits to 1024.
Distinguish total and per-IP limits with five clients
| Total / per-IP limit | Observation and interpretation |
|---|---|
4 / 4 | Five clients from one IP compete for four slots. This result does not isolate either limit. |
8 / 2 | Total capacity is sufficient. With only two same-IP sessions, check per-IP refusals and the other devices. |
8 / 8 | Verify five actual connections and new samples from every device. Eight permitted slots do not mean eight established connections. |
The total cap may reject a connection without increasing the security-refusal counter. Cumulative refusals need not reset after recovery; compare increments within the observation window.
Check quotas even when CPU has spare capacity: rejected connections directly affect collection.
3. Increase the load and record results
In an empty project, generate 1000 devices, 1000 independent TCP channels, and 1000000 variables in one batch, with 1000 points per device. Run the connection and variable load together in the same project. Keep all devices, variables, and source connections online during measurement.
These logical devices share a local Modbus endpoint. They do not represent the same number of physical instruments or reproduce serial links, remote networks, or different device response times. A thousand independent connections and concurrency one thousand on one channel are separate cases.
Record creation and steady state separately
- Record initial totals, hardware, software settings, and source capability.
- Time batch creation separately and verify the actual channel, device, and variable counts.
- Wait for all devices and connections to stabilize. Spot-check valid new values at first, middle, and last addresses.
- Use .NET runtime diagnostics to trigger a full Gen2 GC. Confirm that collection has ended and execution has resumed, then wait 30 seconds. Keep the load running and begin a steady-state window of at least 300 seconds, sampling CPU and other process resources every 2 seconds.
- Save all-device and source counters at both ends. Verify that every device's success count grows, and check failure, protocol-error, and security-refusal increments.
- After the steady-state window, trigger another full GC, confirm completion, and wait 30 seconds. Read working set and private memory with the load still running, and recheck device, variable, and connection counts.
Time creation, warmup, GC, and post-GC settling separately. CPU statistics start after the first full GC and settling period; final memory is read after the second full GC and settling period. Use 300 seconds for initial observation and extend the test for project endurance requirements.
Metric definitions and measurement boundaries
| Metric | Meaning |
|---|---|
| Online variables | Point-in-time quality count, rather than updates per second. |
| Protocol request rate | Request increment divided by actual elapsed seconds. A request may contain many variables. |
| Device-success increment | Successful device operations, recorded separately from protocol requests. |
| Execution interval | Scheduling input. Packet counts, timeouts, retries, and source speed also affect complete scans. |
| Process CPU | State whether it is normalized by logical processor count. It is not whole-machine CPU usage. |
| Working set / private memory | Different process-memory metrics; neither is managed heap size. |
Measure request rates and point-update rates separately. A request may cover many variables. Use complete scan times and new samples from individual variables to assess refresh capability.
1000 devices and one million variables in one run
One project ran 1000 devices, 1000 independent TCP channels, and one million variables, with 1000 points per device and a 1000 ms execution interval. Collection and the built-in Modbus simulator shared one host process and a local source endpoint. The host had 24 logical processors.
CPU was measured over a 306.71-second steady-state window beginning 30 seconds after a full GC completed. After that window, another full GC completed, followed by a 30-second settling period before memory was read with the load still running. Measurements include both collection and simulator work.
| Metric | Measured result |
|---|---|
| Steady-state process CPU mean / maximum | 15.36% / 20.75% |
| Working set after full GC | 1264.97 MiB |
| Private memory after full GC | 1076.73 MiB |
CPU is host-process usage normalized by 24 logical processors. Memory values are individual readings after the second full GC; one MiB is 1024² bytes. At least 1000 devices and 1000 connections stayed online throughout steady state, every device's success count advanced, and one million variables were online at the end.
View sampling and runtime details
| Metric | Measured result |
|---|---|
| Batch creation time | About 164.75 s, timed separately |
| Steady-state process-resource samples | 152, about one every 2 seconds |
| Source protocol-request increment | 3067409 |
| Device-success increment | 30638 |
| Device failures / protocol errors / security refusals | 0 / 0 / 0 |
Both full GCs were confirmed by Gen2 collection completion and execution resumption. Every CPU sample lies within the steady-state window after the first GC, and the mean is weighted by actual sampling intervals. At the final memory reading, 1000 devices, one million variables, and 1000 connections remained online.
These results describe the local simulation workload above. Validate your physical instruments, network, expressions, alarms, forwarding, and database work with your own configuration. Protocol request rate does not directly establish point-update throughput.
4. Tune and verify acceptance
Change one condition at a time and compare equal observation windows:
- Check contiguous addresses and packing limits to avoid unnecessary single-point requests.
- Select a period that meets freshness requirements and observe complete scan time.
- Adjust independent channels and concurrency within protocol capability; check source refusals and failure increments.
- Add real expressions, alarms, rules, forwarding, and database work, then measure the full workload again.
- Verify normal operation, slow receivers, outages, replay, and backlog recovery.
Charting, extensive Trace logging, and automatic refresh add measurement overhead. Record enabled features and use the same full-GC procedure, settling period, and observation window when comparing resource usage.
Compare scan periods and packing on one device
Enable one test device, retain the others disabled, and verify that only one source connection remains. Use ten continuous Int16 holding registers as fixed input. Save and reopen each setting to confirm it.
Period, packing, concurrency, and timeout comparisons
| Parameter | Interpretation |
|---|---|
Intervals 1000 → 2000 → 1000 ms | Compare actual request and complete-cycle increments. Short-window rates need not halve exactly. |
FC3 holding-register limit 1 versus 10 | More split requests versus permitted packing; address, type, and packing rules still apply. |
| Channel concurrency | Limits work within one channel. Count independent connections separately. |
| Read/write timeout | Larger budgets may extend fault waiting without increasing healthy throughput. |
| Retries | Additional fault traffic and occupancy, distinct from new device successes or point updates. |
| Pre-frame delay and duty cycle | Source timing and task allocation; together with packet counts, these affect complete scans. |
Restore device enabled states and production parameters, then check every connection, quality state, and new success increment. See Collection Strategy and Modbus Master.
Record results
Keep the load, periods, packing, hardware, actual duration, steady-state mean and peak CPU, post-full-GC memory, failure increments, and all-device results. A short run does not establish indefinite endurance or arbitrary physical-device capacity. Allocation rate, GC pauses, and protocol-latency percentiles require direct measurements.
Related operations: Batch Configuration · Protocol Simulator and Connection Quotas.