GeSrtpMaster
Purpose
GE SRTP PLC address reading and writing, status and clock diagnostic driver
Open the plugin
Enter "Development Configuration → Collection Configuration", create a device and select "GeSrtpMaster" in "Collection Plugin".
Supported channels and data types
| Channel type | Pre-configuration check |
|---|---|
| TCP Client | Confirm network reachability of the device IP, port, and gateway to the device. |
Optional data types: Boolean, Byte, Int16, UInt16, Int32, UInt32, Int64, UInt64, Float, Double, String
Address rules
- GE SRTP addresses start with 1.
- I, Q, M, T, SA, SB, SC, S, G support boolean and raw byte access, such as M1, Q100.
- AI, AQ, R use sixteen-digit WORD access, such as R1, AI100, and do not support Boolean bit access.
- The default TCP port of PLC is 18245; the initialization exchange will be re-executed every time TCP reconnects.
Special methods
| Method | Purpose | Parameters |
|---|---|---|
| ReadClockAsync | Read PLC clock | No parameters |
| ReadProgramNameAsync | Read program name | No parameters |
Functions
| Function | Purpose |
|---|---|
| Read PLC clock | Use Read PLC clock to inspect mapped values, status, counters, recent messages, or the latest result. |
| Read program names | Use Read program names to inspect mapped values, status, counters, recent messages, or the latest result. |
Device debug
Enter "Development Configuration → Collection Configuration", select the current device and click "More Functions", then open "Debug".
Dedicated debugging page
The protocol debugging page is used to read the device status and register data of GE SRTP.
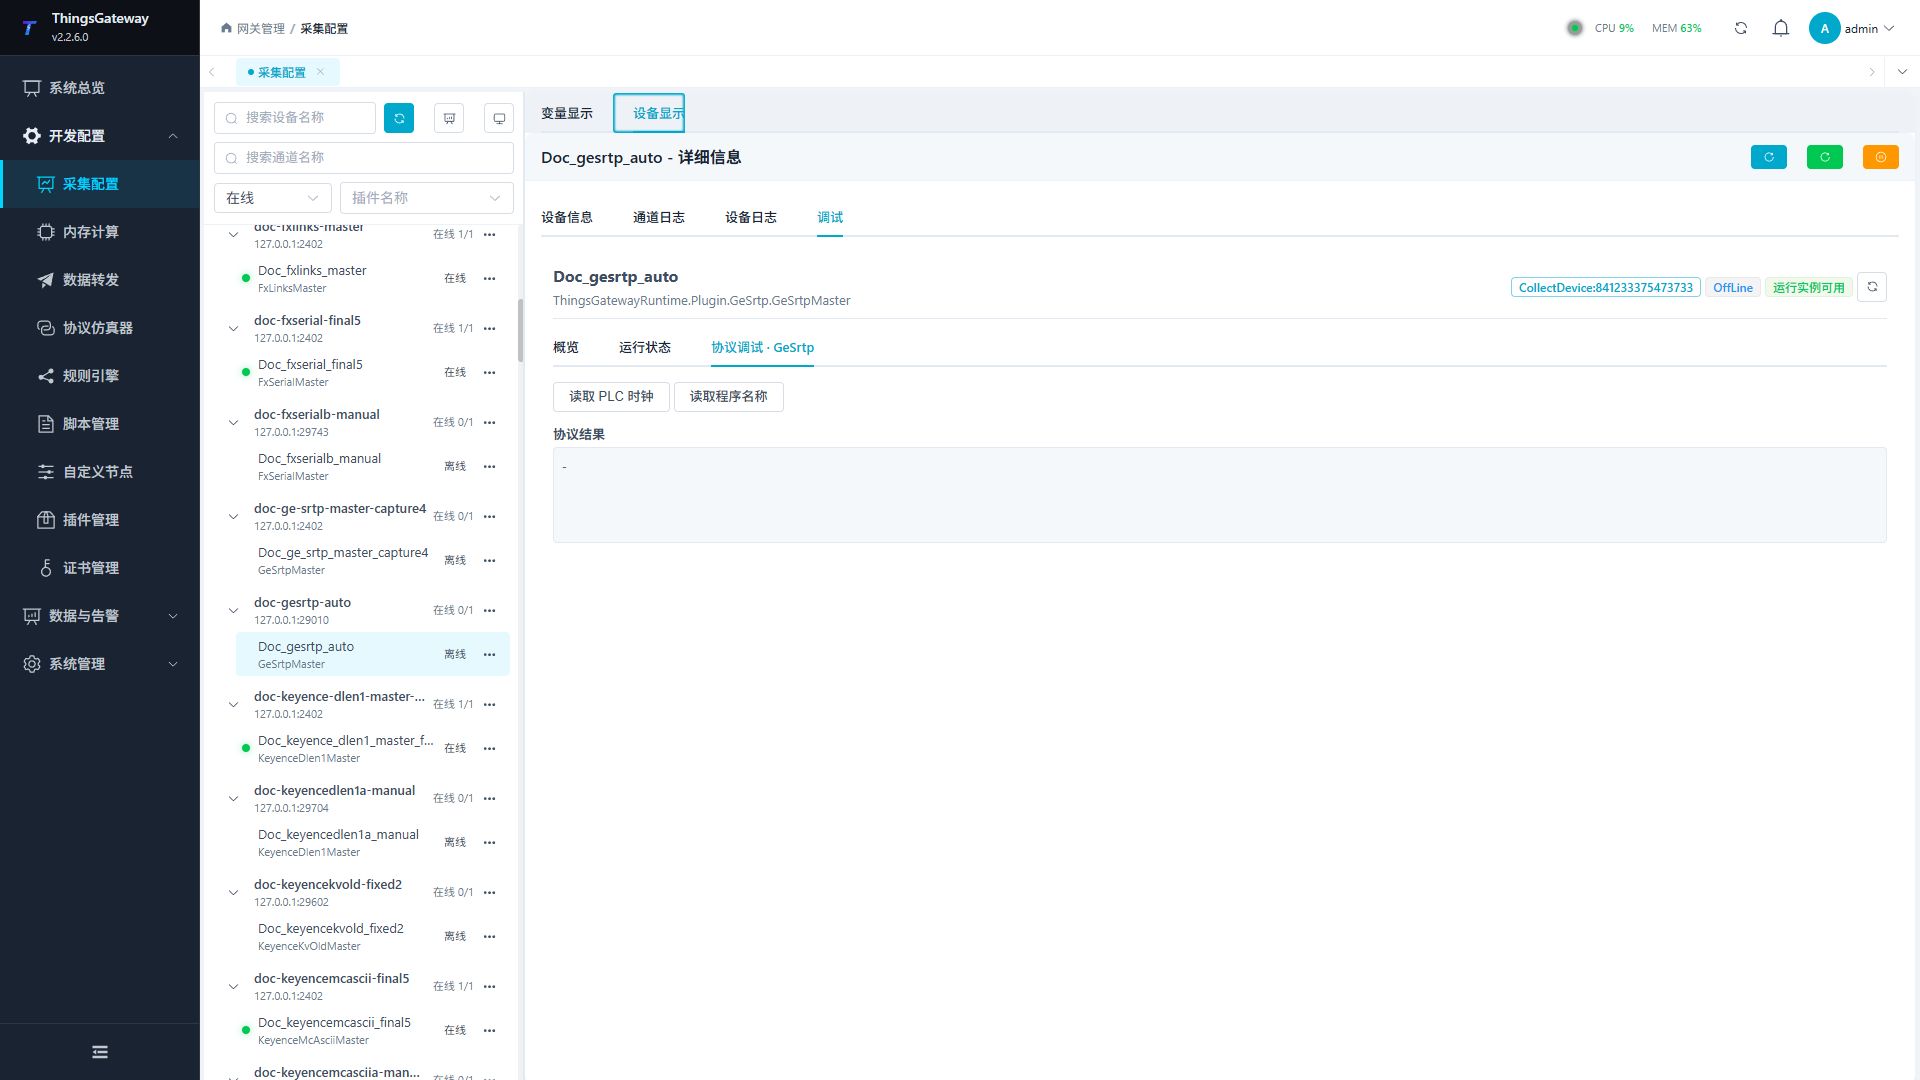
Debugging notes
The dedicated page verification can be completed by reading the PLC clock and current program name. There is no writing operation on this page.
Verify the configuration
- Use the plugin-specific debug panel with one confirmed test point or test message.
- Confirm that the returned value or received message matches the device point list.
- Perform writes or control operations only with an approved test point and the site safety procedure.
Troubleshooting
- The debug panel shows no result: Check the required inputs and plugin parameters, then inspect the device or target log for a response or error.
- Special method execution fails: Check method parameters and permissions; control, write or reset methods also need to confirm that the device is in a state that allows operation.
Related links
- Collection configuration: View channel, device and common variable configuration.
- Plugin Index: Find other collection or data-forward plugins.