On this page
System Logs
Open System Management → System Logs, choose the relevant record type, and filter by time and keywords.
Find a record
- Choose a tab using the table below.
- Narrow the time range to a few minutes around the operation. Start with today if its time is unknown.
- Enter an account, keyword, or status and click Query.
- Open Details on the matching record to read the full message; the list can truncate it.
- Use Export when sharing records. Check for passwords, tokens, and connection information before sending the file.
| Investigation | Where to look |
|---|---|
| Startup, plugin loading, or runtime exceptions | Background Logs. |
| Who changed configuration or why a page operation failed | Operation Logs, then background errors at the same time. |
| External reads, writes, or plugin-method calls | RPC Logs, then the relevant device or target log. |
| Database failures or slow queries | SQL Logs. |
| Logins, account locking, or permission changes | Audit Logs; this tab requires audit-log permission. |
| A device has no new value | In Collection Configuration, select the device and open Channel Log or Device Log at the top of its workspace. |
| A target does not upload | Its target log and forwarding-group log in Data Forwarding. |
Inspect logs by type
Background Logs
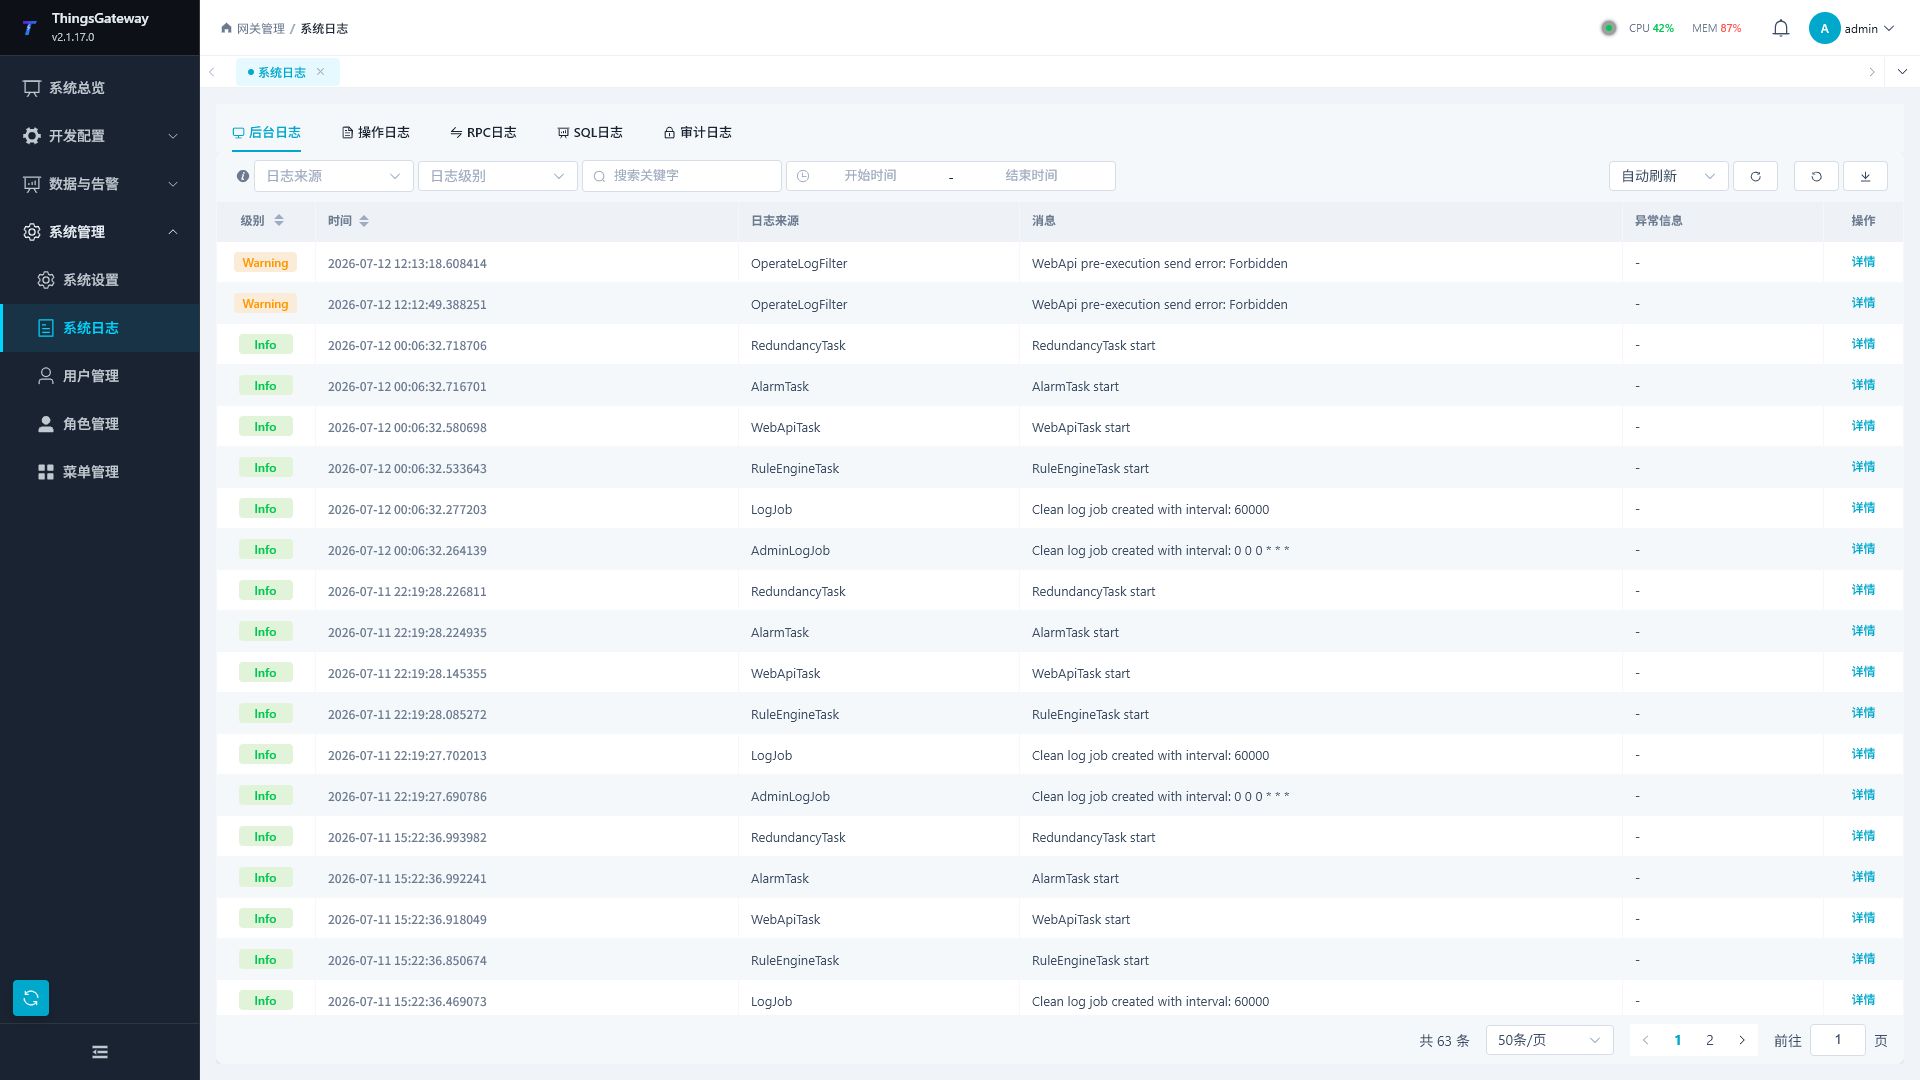
Filter by Error or Warning when investigating an exception. Include Info when checking normal startup or runtime events. Use Trace and Debug temporarily, then restore the required operating level.
| Operation Items | Description |
|---|---|
| Log Level | By Trace, Debug, Info, Warning, Error, and Critical level filtering. |
| Time Range | Limit the time when the log occurred. |
| Keywords | Search by log content or anomalous information. |
| Query/Reset | Query by condition or restore the default filter conditions. |
| Export | Export logs within the current query range. |
| Automatic Refresh | Continuously update the log list according to the refresh interval provided by the page. |
| Details | Open the log details to view the full log content and anomalies. |
| column | Explanation |
|---|---|
| time | log occurrence time. |
| Level | Log Level. |
| Source | Log source. |
| Log Content | Log Messages. |
| Exception information | Details of the exception stack or error. |
Operation Log
Request Source is MCP for tool calls or WebApi for ordinary HTTP API calls, including the management frontend. The server identifies the source.
Operation log is used to track business operations performed by users on web pages.
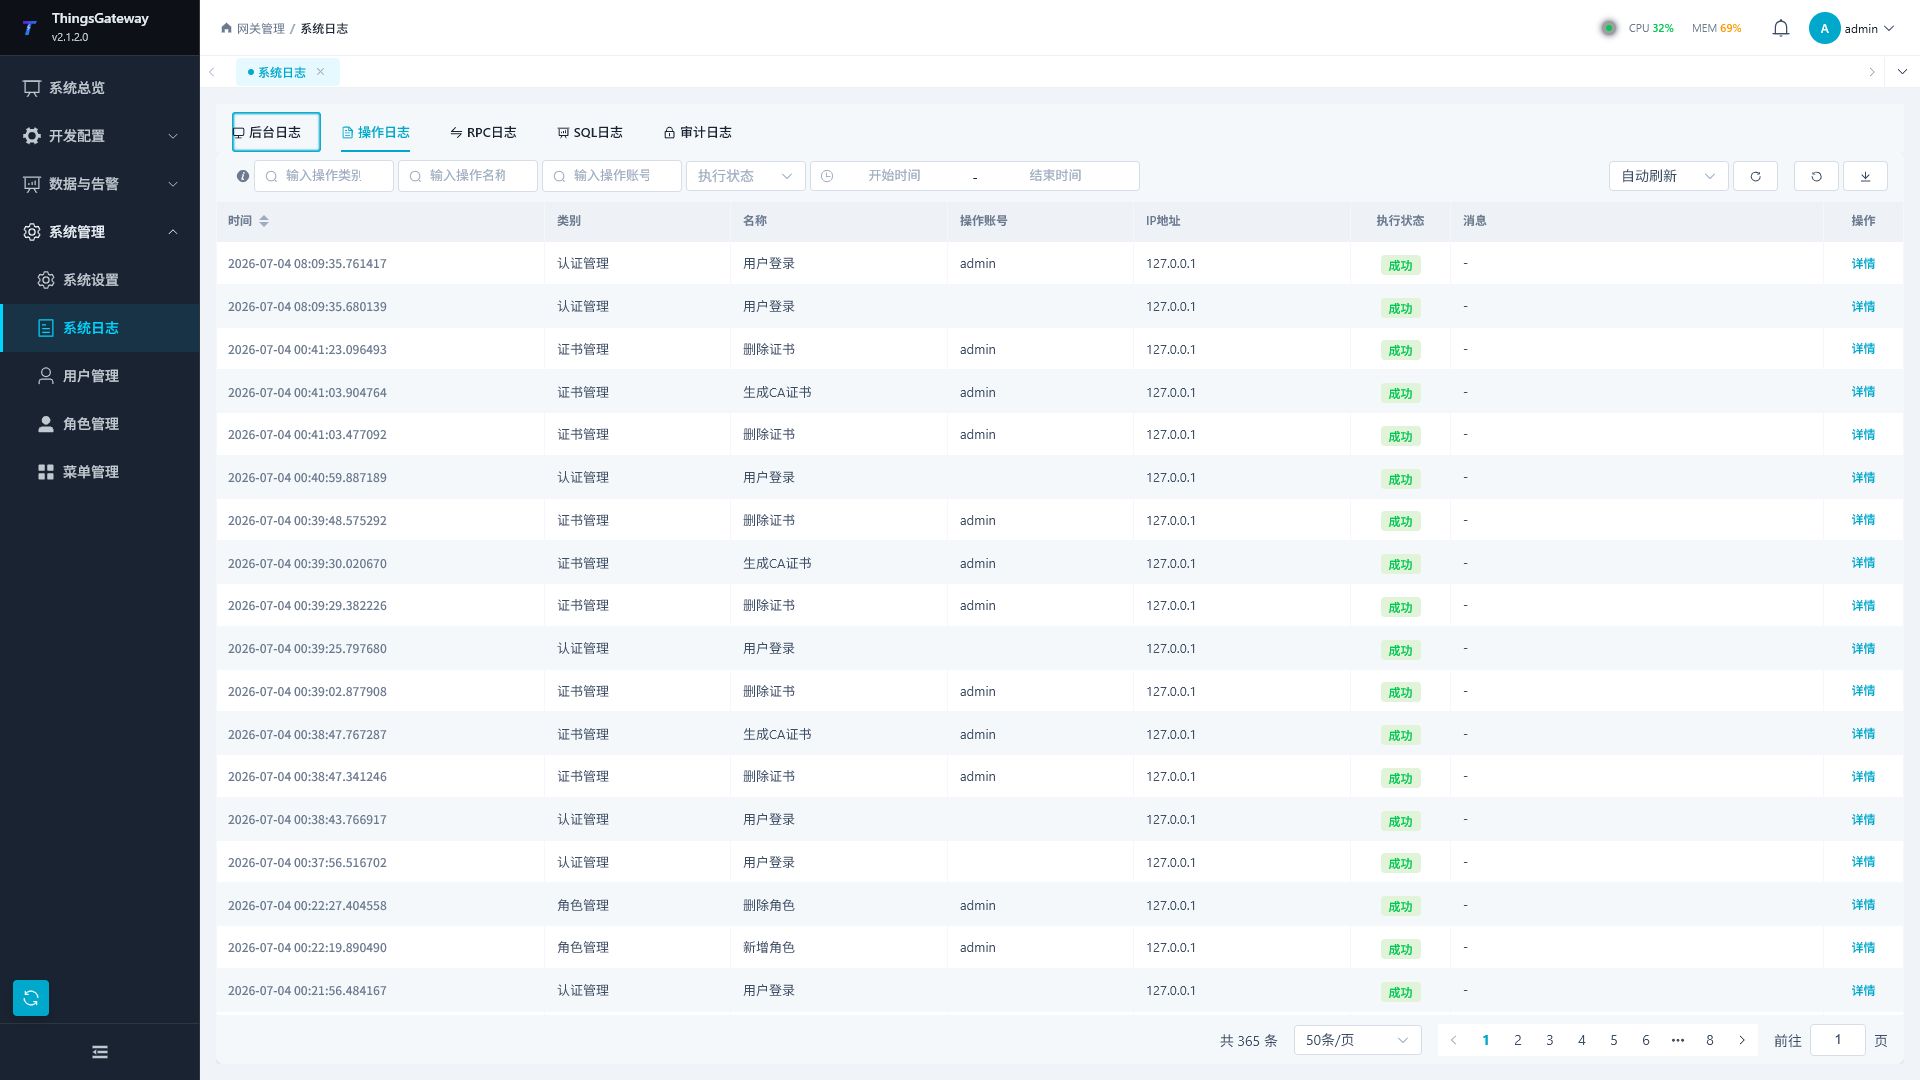
| Filter Items | Description |
|---|---|
| Operation Categories | Filter by function category, such as configuration, permissions, operation control, etc. |
| Operation Name | Filter by specific operation name. |
| Operating Accounts | Filter by the login account that performs the operation. |
| Run Status | Filter for success or failure records. |
| Time Range | Limit the time when operations occur. |
| column | Description: |
|---|---|
| time | operation occurrence time. |
| Category / Name | The category to which the operation belongs and the operation name. |
| Method | Name of the method called by the operation. |
| Operating Account | User performing the operation. |
| IP address | user’s access source address. |
| Status | Operation successful or failed. |
| Message | Explanation of operation results. |
Click “Details” to view the request method, address, parameters, processing results, and error messages. For issues involving account, permission, or configuration adjustments, the details of the operation log should be saved first.
RPC Log
For variable writes and plugin-method calls, Operation Source distinguishes MCP and WebApi. Combine it with the account to identify the entry point.
RPC logs include variable RPC and direct plugin method calls from formal Web API, MQTT, UA, debug special methods, and rule special-method nodes. Resolved objects display device or target names. Details retain full parameter/result JSON, duration, status, business code, and diagnostics without rounding numeric text.
Ordinary successes follow the RPC-success-log setting; failures and business or serialization diagnostics are still recorded. Writes are asynchronous, so refresh after a short delay if needed. Basic address reads in collection debugging should also be checked in device logs.
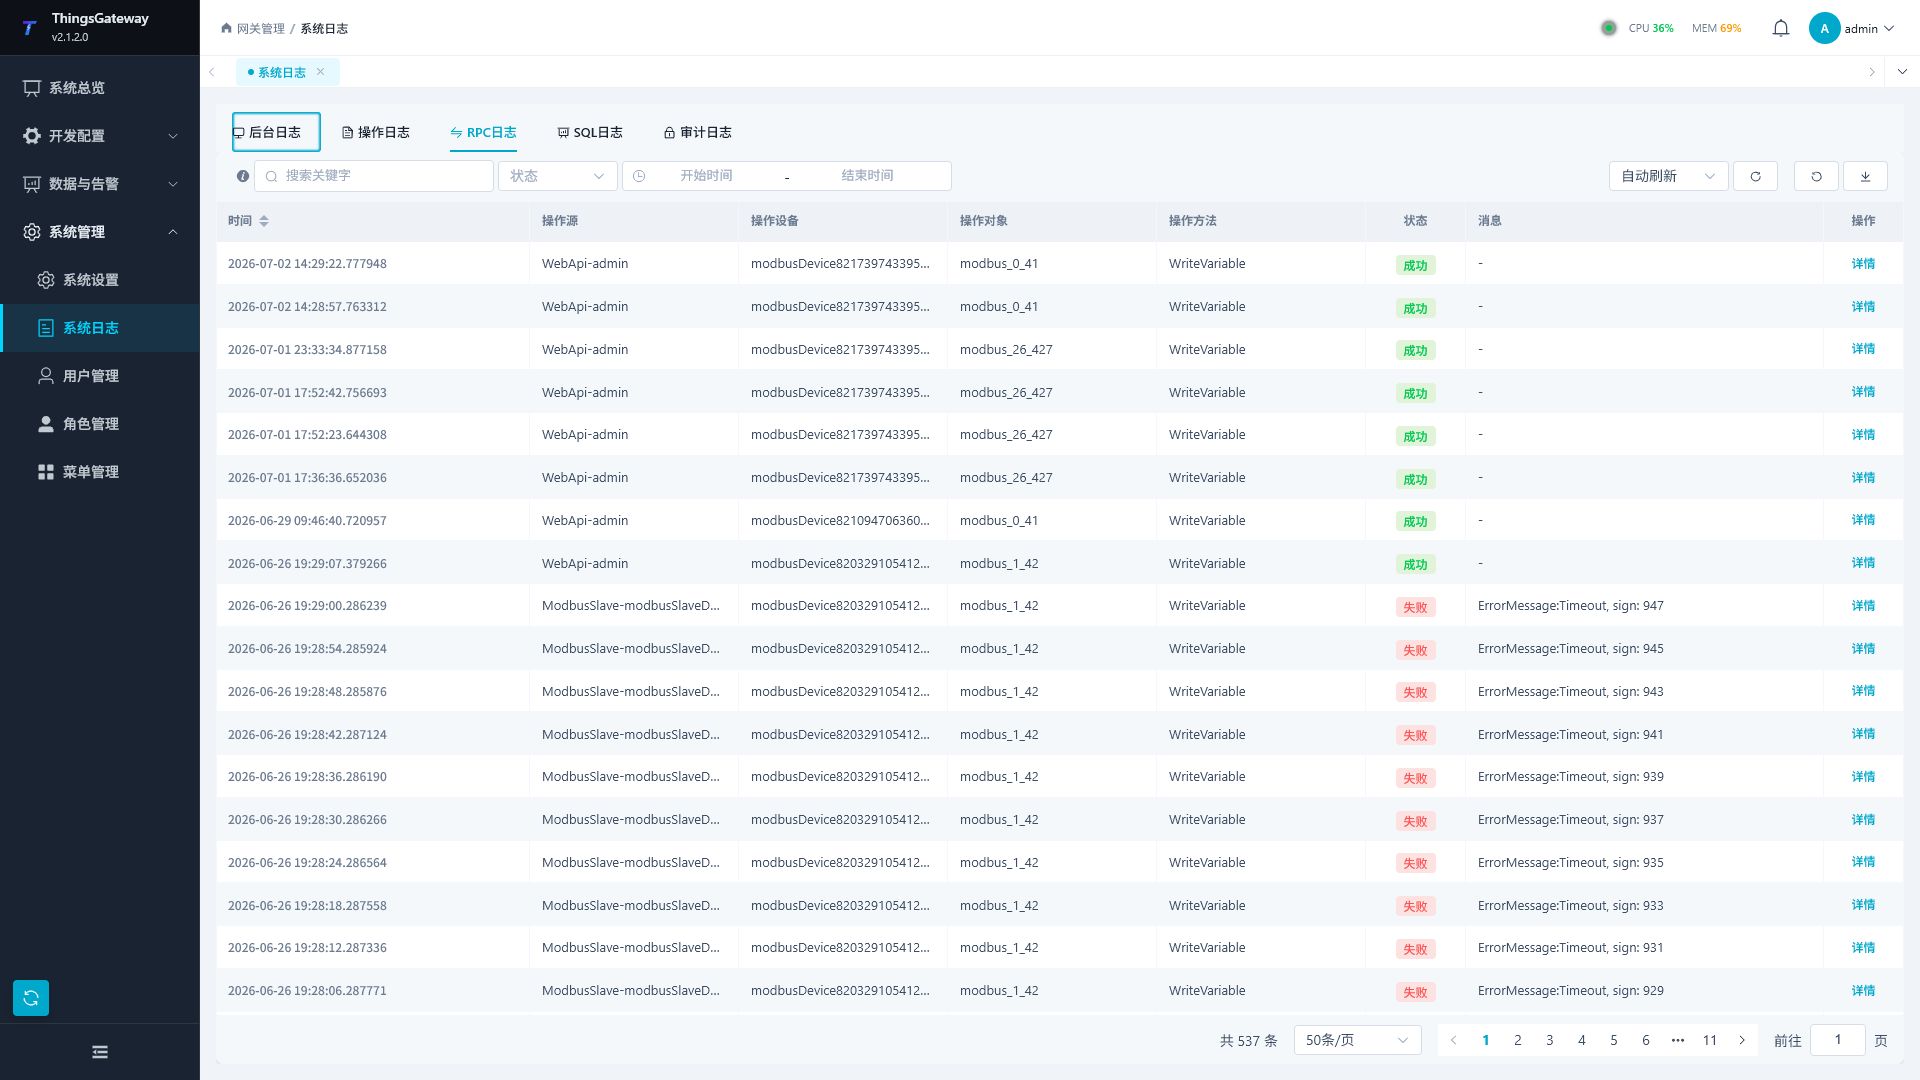
| Filter | Description |
|---|---|
| Search keywords | Search by call source, device, object, method, or message. |
| Status | Filter for successful or failed calls. |
| Time Range | Limit call times. |
| column | Explain the |
|---|---|
| time | the time the call occurred. |
| Source of Operations | Source of call, such as external systems, protocol entry, or interface callers. |
| Operate the device | Call the associated device. |
| Operation Object | The Object being Invoked. |
| Operation Methods | Write, read, or other calling methods. |
| State | Whether the call was successful. |
| Message | Invocation result or failure reason. |
SQL Logs
SQL logs are used to troubleshoot database access issues and slow queries.
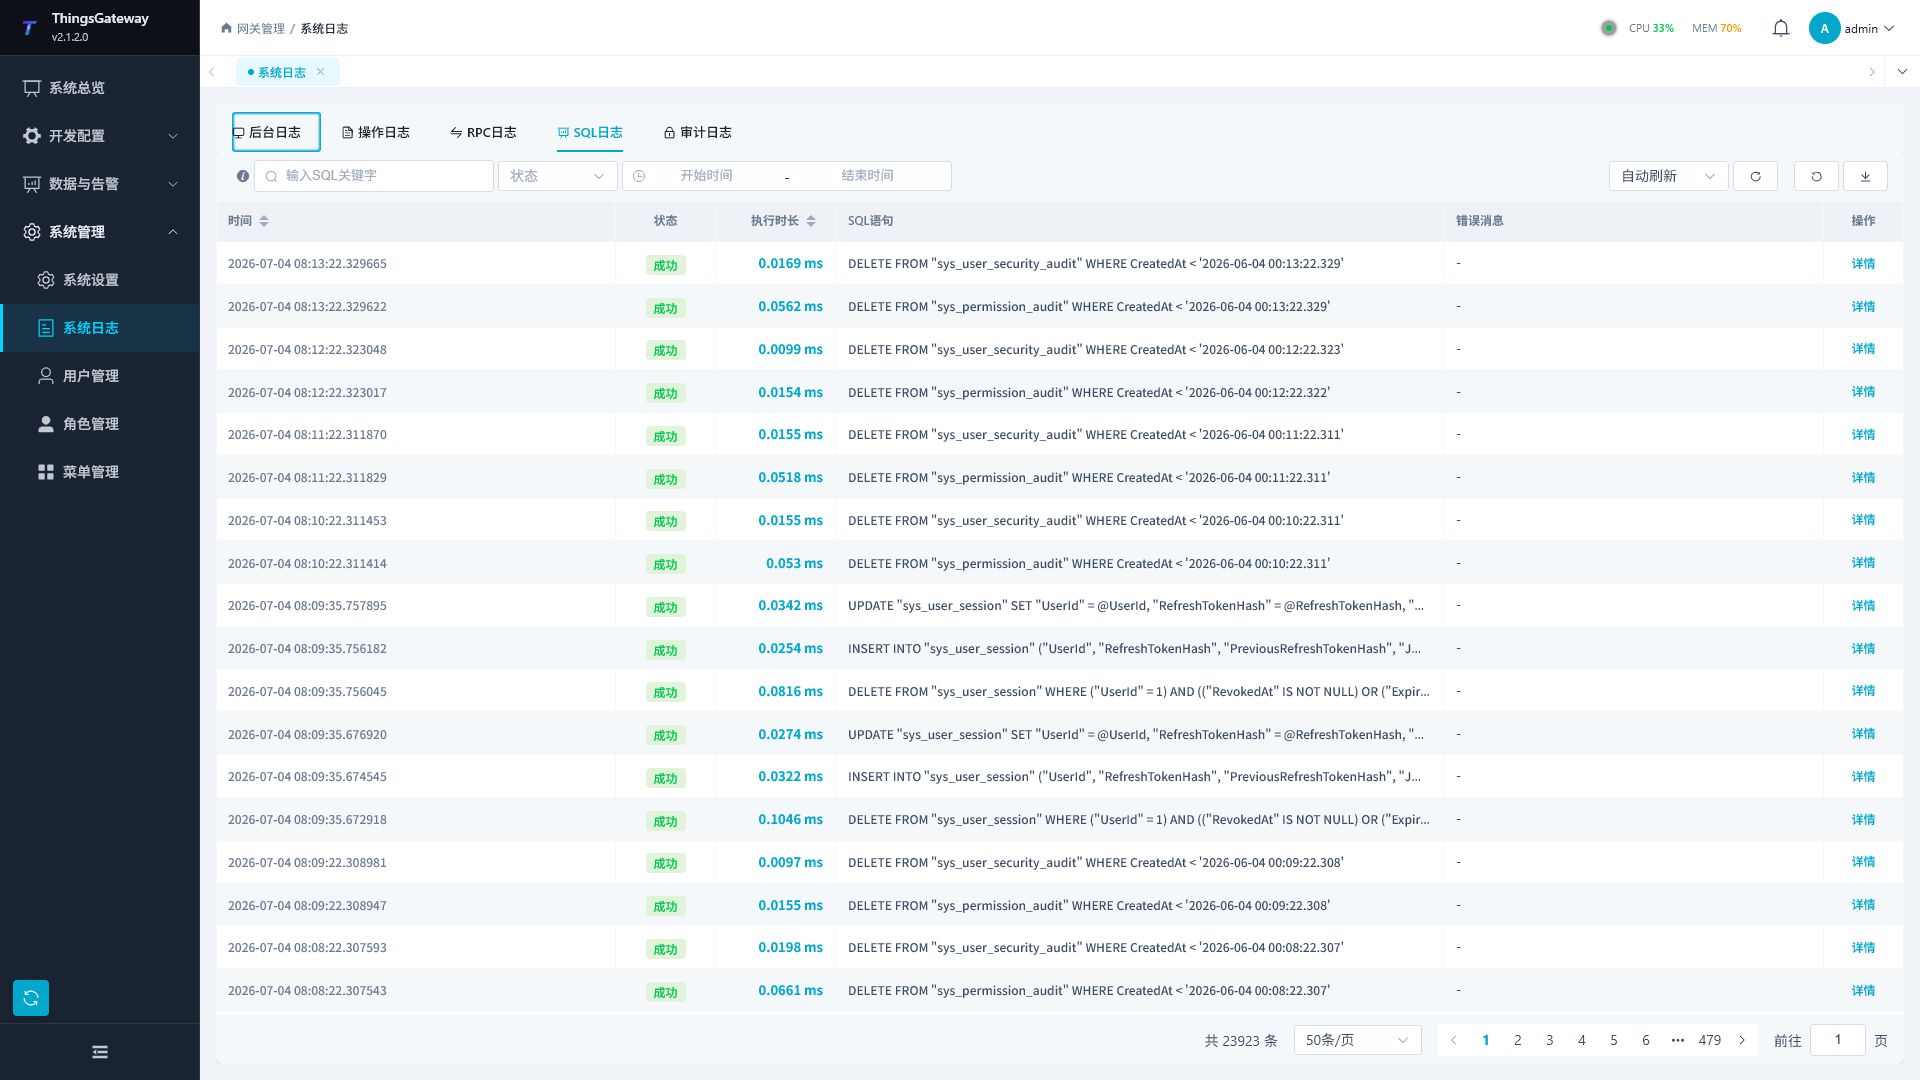
| Filter Items | Description |
|---|---|
| SQL Keywords | Search by SQL Statement Content. |
| Status | Filter successful or failed SQL operations. |
| Time Range | Limit SQL execution time. |
| column | Describes |
|---|---|
| time | SQL execution time. |
| Status | Execution successful or failed. |
| Execution duration | Time taken by the database operation. |
| SQL statements | executed SQL content. |
| Error messages | Error explanations on failure. |
Click “Details” to view SQL parameters, execution time, number of affected rows, database configuration, and complete error messages.
Audit Logs
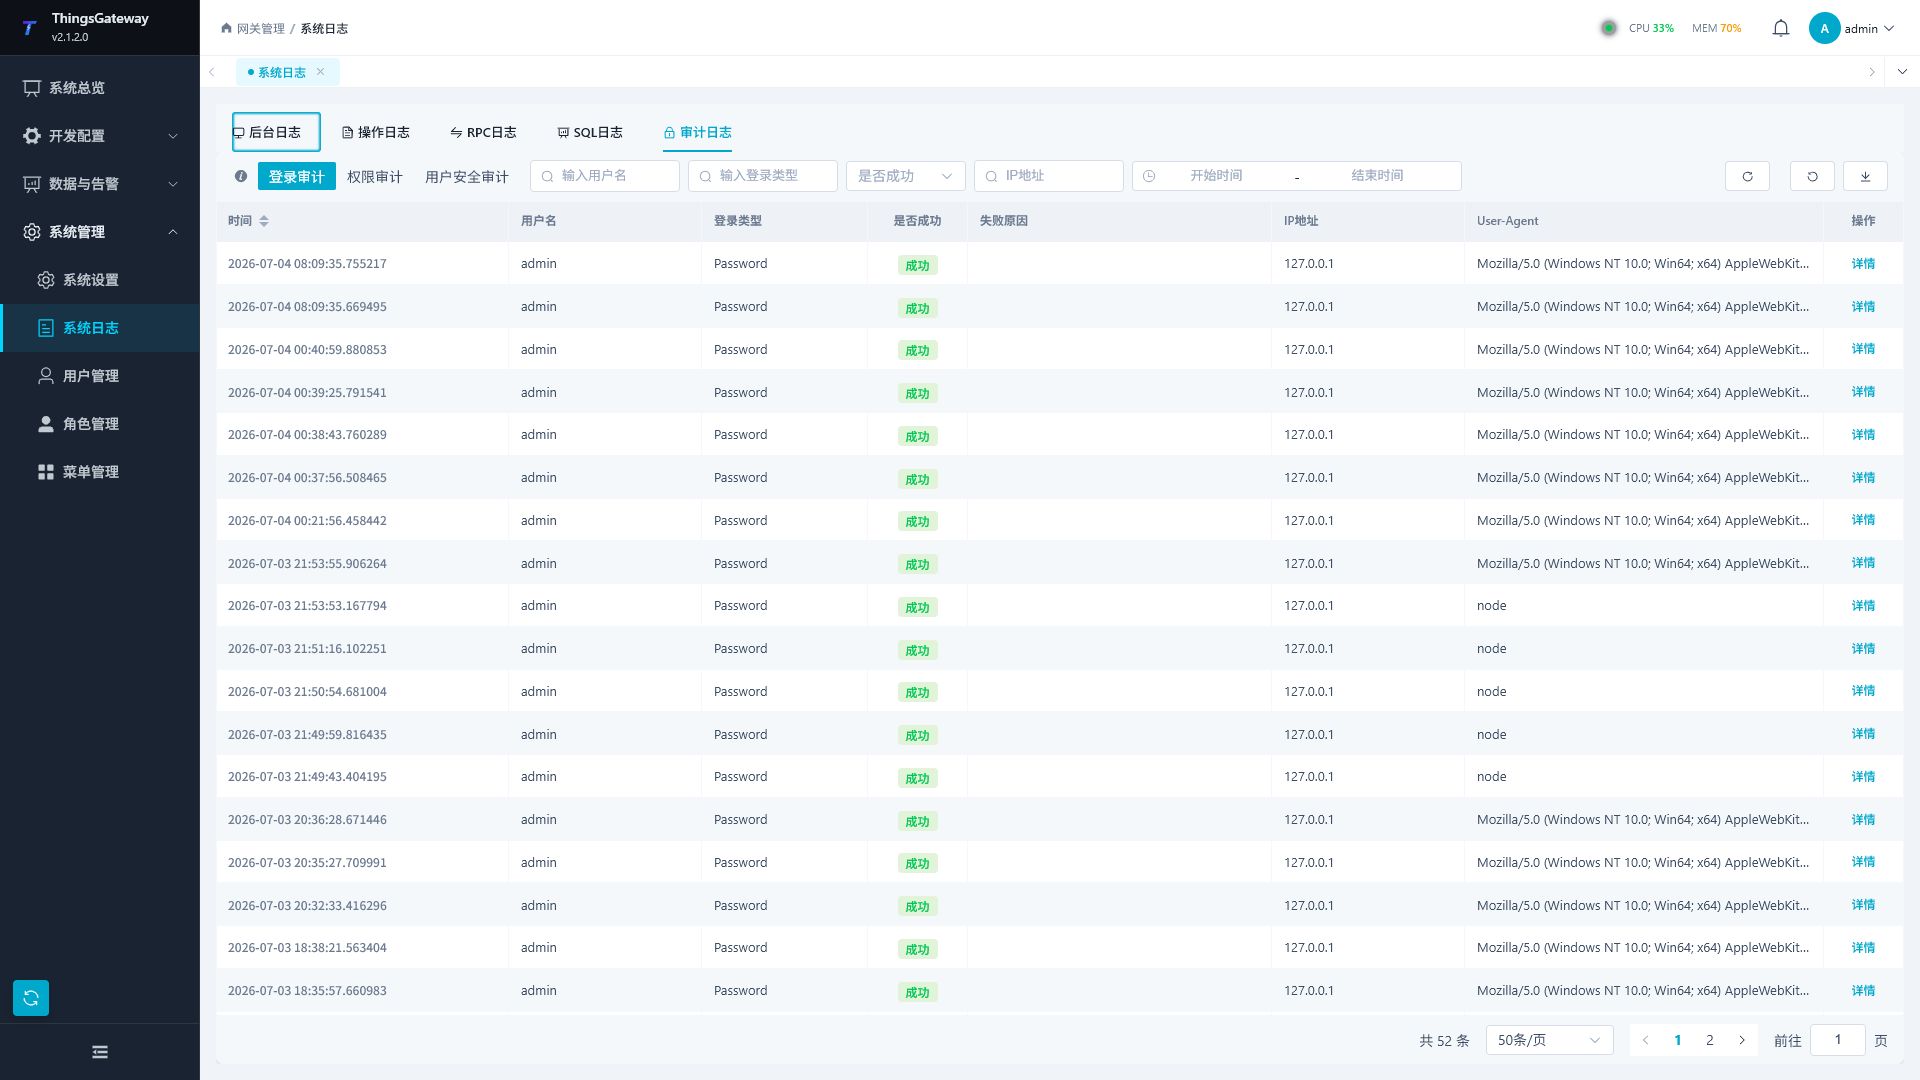
Audit logs are used to track logins, permission adjustments, and user security events.
| Audit Type | Description |
|---|---|
| Login Audit | Query login username, login type, success status, failure reason, IP address, and User-Agent. |
| Permission Auditing | Query role permission changes, including before, after, and operator changes. |
| User Security Audit | Query security actions related to user locking, unlocking, session revocation, and passwords. |
Retention and capacity
Logs are cleaned periodically according to deployment settings. Before investigating an old issue, check retention days and maximum rows and export the required range. Log databases are not permanent business-history stores.
In the gateway’s Configuration/LoggerOptions.json, GatewayLogOptions controls RPC, channel, device, rule, forwarding, and protocol-simulator events. AdminLogOptions controls backend, operation, SQL, and audit logs. Apply file changes by restarting through your deployment process in a maintenance window, then verify effective settings.
| Setting | Effect |
|---|---|
Retention days such as RpcLogDaysAgo | Deletes records older than the retention cutoff. Published configuration commonly uses 30 days; inspect the deployed file. 0 days does not disable cleanup. |
RpcLogMaxRowCount, ChannelLogMaxRowCount, DeviceLogMaxRowCount, DataForwardLogMaxRowCount | Row limits for the corresponding log database. 0 disables row trimming; age cleanup still runs. |
RuleEngineLogMaxRowCount | Per-rule log row limit. It must be positive; nonpositive values use 500000. |
ProtocolSimulatorLogMaxRowCount | Per-simulator-channel event row limit. 0 disables row trimming; published configuration uses 2000000. |
RpcSuccessLog | Controls ordinary successful RPC records, rather than disabling failures and diagnostics. |
Capacity cleanup removes older excess rows and preserves newer records. Equal timestamps do not cause extra rows to be deleted. Cleanup is periodic, so ongoing writes can temporarily exceed the row limit. Independent channel, device, target, and rule databases each have their own capacity; this is not a process-wide limit in disk bytes.
Troubleshooting Recommendations
| Phenomena | Recommendations to Check |
|---|---|
| Page Operation Failures | First check the failure message in the operation log, then check if the backend log has an exception stack. |
| External system write failure | Review RPC logs to confirm the source of operations, target devices, methods, and cause of failure. |
| Slow database response | Check the execution duration of SQL logs and SQL statements. |
| Account Abnormal Login | View Login Audit and User Security Audit in the Audit Log. |
Related Links
- System Overview - System Status Monitoring
- Collection Configuration - View Channel Logs and Device Logs
- System Settings - Gateway System Configuration