On this page
System Monitoring and Memory Analysis
Open System Management → System Monitor to inspect gateway process resources, memory sources, hardware, and networking. Check the sample time before comparing successive samples. Device health and collection paths are covered in System Overview.
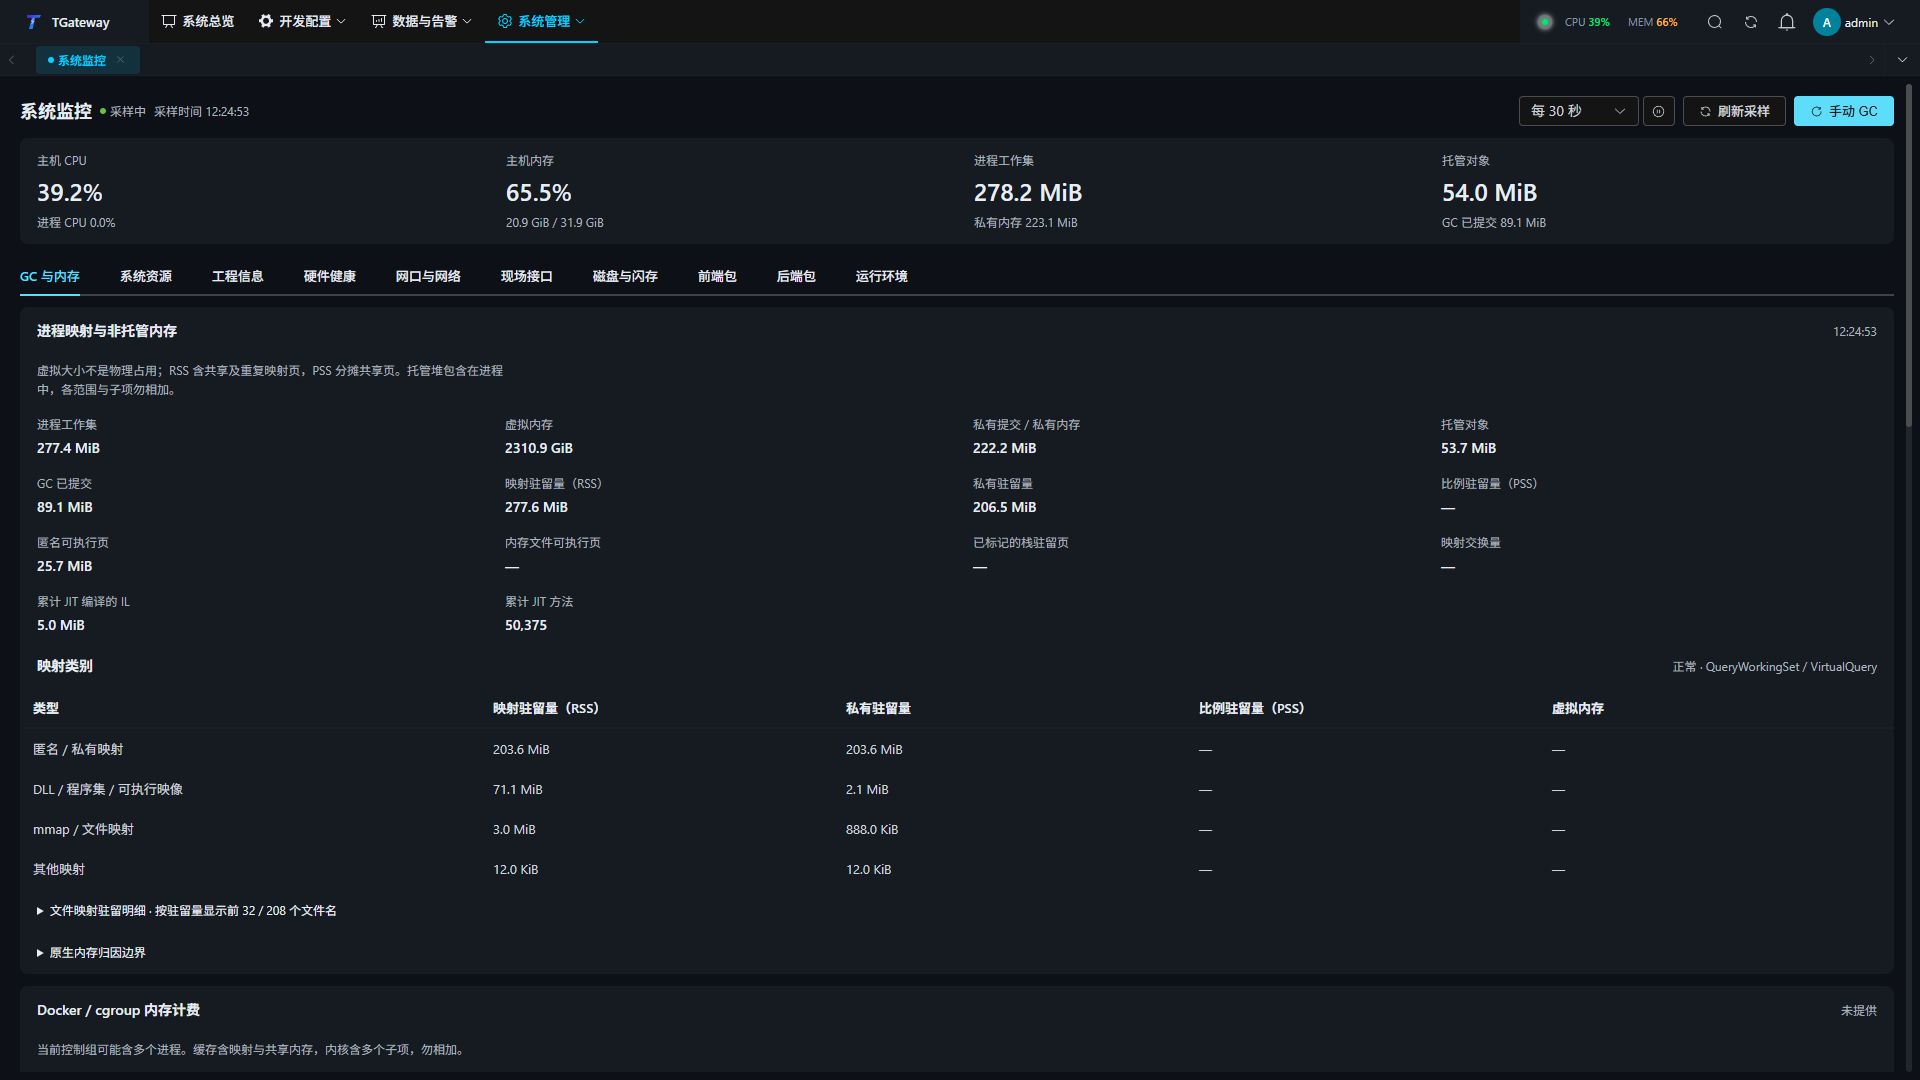
Sampling and navigation
- Wait for the first sample and check its time at the top right.
- Select an automatic refresh interval. Pausing the page does not stop collection or forwarding.
- Use Refresh Sample to obtain an available sample. Resources are collected at most once every 30 seconds, so repeated clicks can return the same sample.
- Select a tab below. Permissions determine available content;
—, unavailable values, and collection errors do not mean zero.
| Tab | Purpose |
|---|---|
| GC and Memory | Resident mappings, container memory, managed heaps, allocation rates, collection counts, and pauses. |
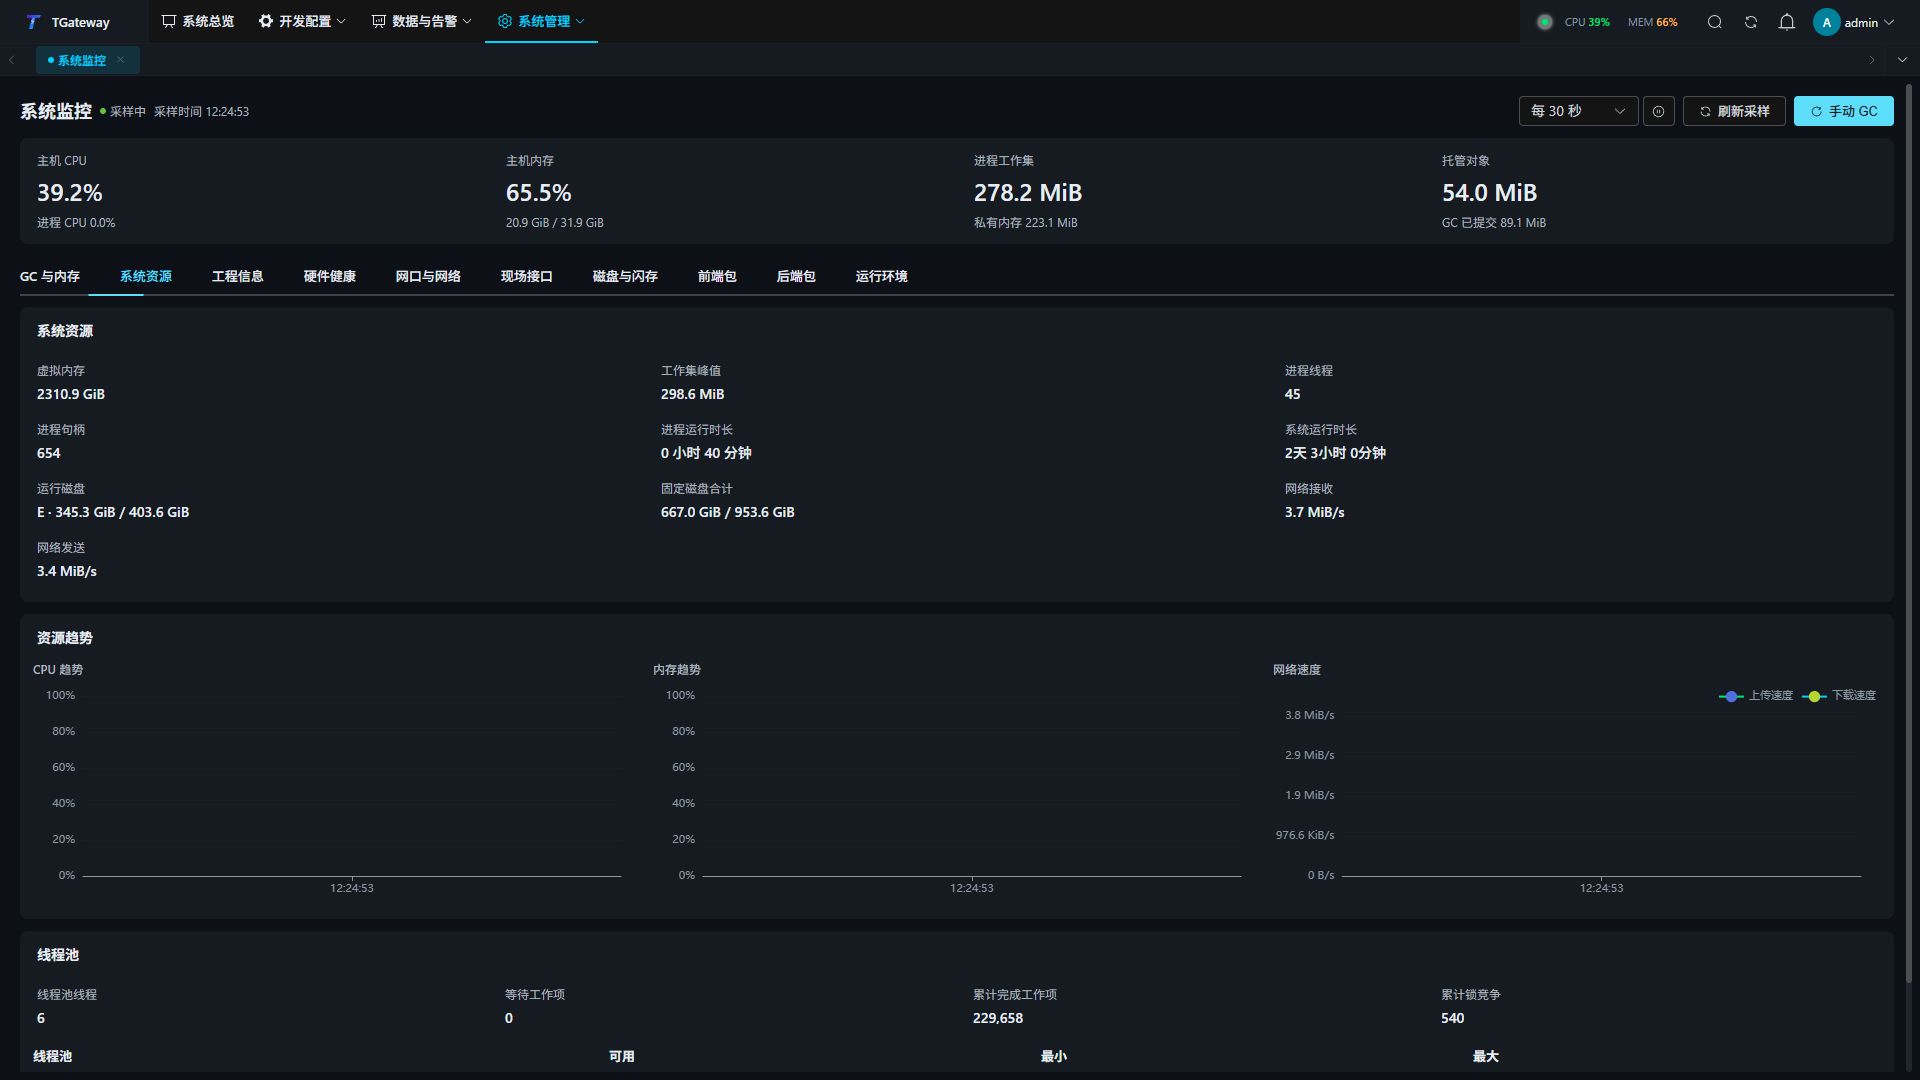
| System Resources | Process uptime, threads, handles, thread pools, disk I/O, and network rates. |
| Hardware Health | Device and firmware details, per-core load, frequency, temperature, power, and memory pressure. |
| Network Interfaces | Link state, IPv4/IPv6, rates, errors, and checks against an upstream TCP port. |
| Field Interfaces | USB, serial, CAN, and driver bindings reported by the operating system. |
| Disks and Flash | File-system capacity, disk I/O, and available SMART or flash lifetime data. |
| Frontend / Backend Packages | Release versions, dependencies, build files, or loaded assemblies. |
| Runtime Environment | Operating system, .NET runtime, architecture, and GC settings. |
Distinguish memory scopes
Process mappings and managed memory
| Metric | Meaning |
|---|---|
| Process working set | Pages resident in physical memory for this process, including managed heaps and other mappings. |
| Virtual memory | Virtual address space; it is not physical memory consumption. |
| Private commit / private memory | Operating-system measurements of private process memory. Definitions vary by platform. |
| Managed objects / GC committed | Estimated managed object size and committed GC space, both within the process. |
| RSS / PSS | RSS counts resident mappings and can include shared or repeated mappings. PSS apportions shared pages. |
| Private resident memory | Resident mapped pages exclusive to the process. |
| Mapping categories | Image files, ordinary files, memfd, anonymous mappings, and system-identified stacks. |
| Cumulative JIT IL / methods | Compilation activity. IL bytes do not measure generated native-code memory. |
Expand Resident File Mapping Details to inspect the largest files. Entries with the same name are combined within each category, and only the largest entries are shown. Windows supplies available resident-file data without PSS or virtual sizes for this list.
Managed heaps are already included in process memory. Do not add working set, RSS, managed objects, and GC committed together. Use suitable native-memory tools to identify native libraries, native runtime heaps, or unidentified stacks in anonymous mappings.
Linux containers and the host
In Docker/cgroup environments, compare control-group usage with its limit, then inspect anonymous memory, file cache, shared memory, and kernel categories. A control group can contain multiple processes. File mappings and shared memory can be cache subcategories and must not be added twice.
Host file cache and kernel statistics describe the whole machine, even when visible inside a container. Diagnose a container limit using control-group measurements, then compare process and host scopes separately.
Trends and garbage collection
Memory trends offer 5-, 15-, and 60-minute windows containing only collected samples; unobserved periods are not backfilled. Accumulate several samples before comparing managed objects with working set. Use Left/Right to move between samples and Home/End for the first or last point.
Generation sizes and fragmentation come from the last completed GC. Cumulative allocations are not currently live objects. The recent-collection list contains up to 32 sampling observations; observation times are not exact GC event times. Compare trends, allocation rates, and pauses under the same workload.
Investigate process, hardware, and network health
In System Resources, distinguish process uptime from system uptime. Compare queued and completed thread-pool work and lock contention across samples under the same workload.
In Network Interfaces, inspect the field interface and open Details for addresses, gateways, DNS, and errors. Enter the intended upstream host and TCP port, then run the connection check. TCP success proves that a connection can be established; verify protocol authentication and actual data separately. Missing ICMP replies alone do not prove TCP failure.
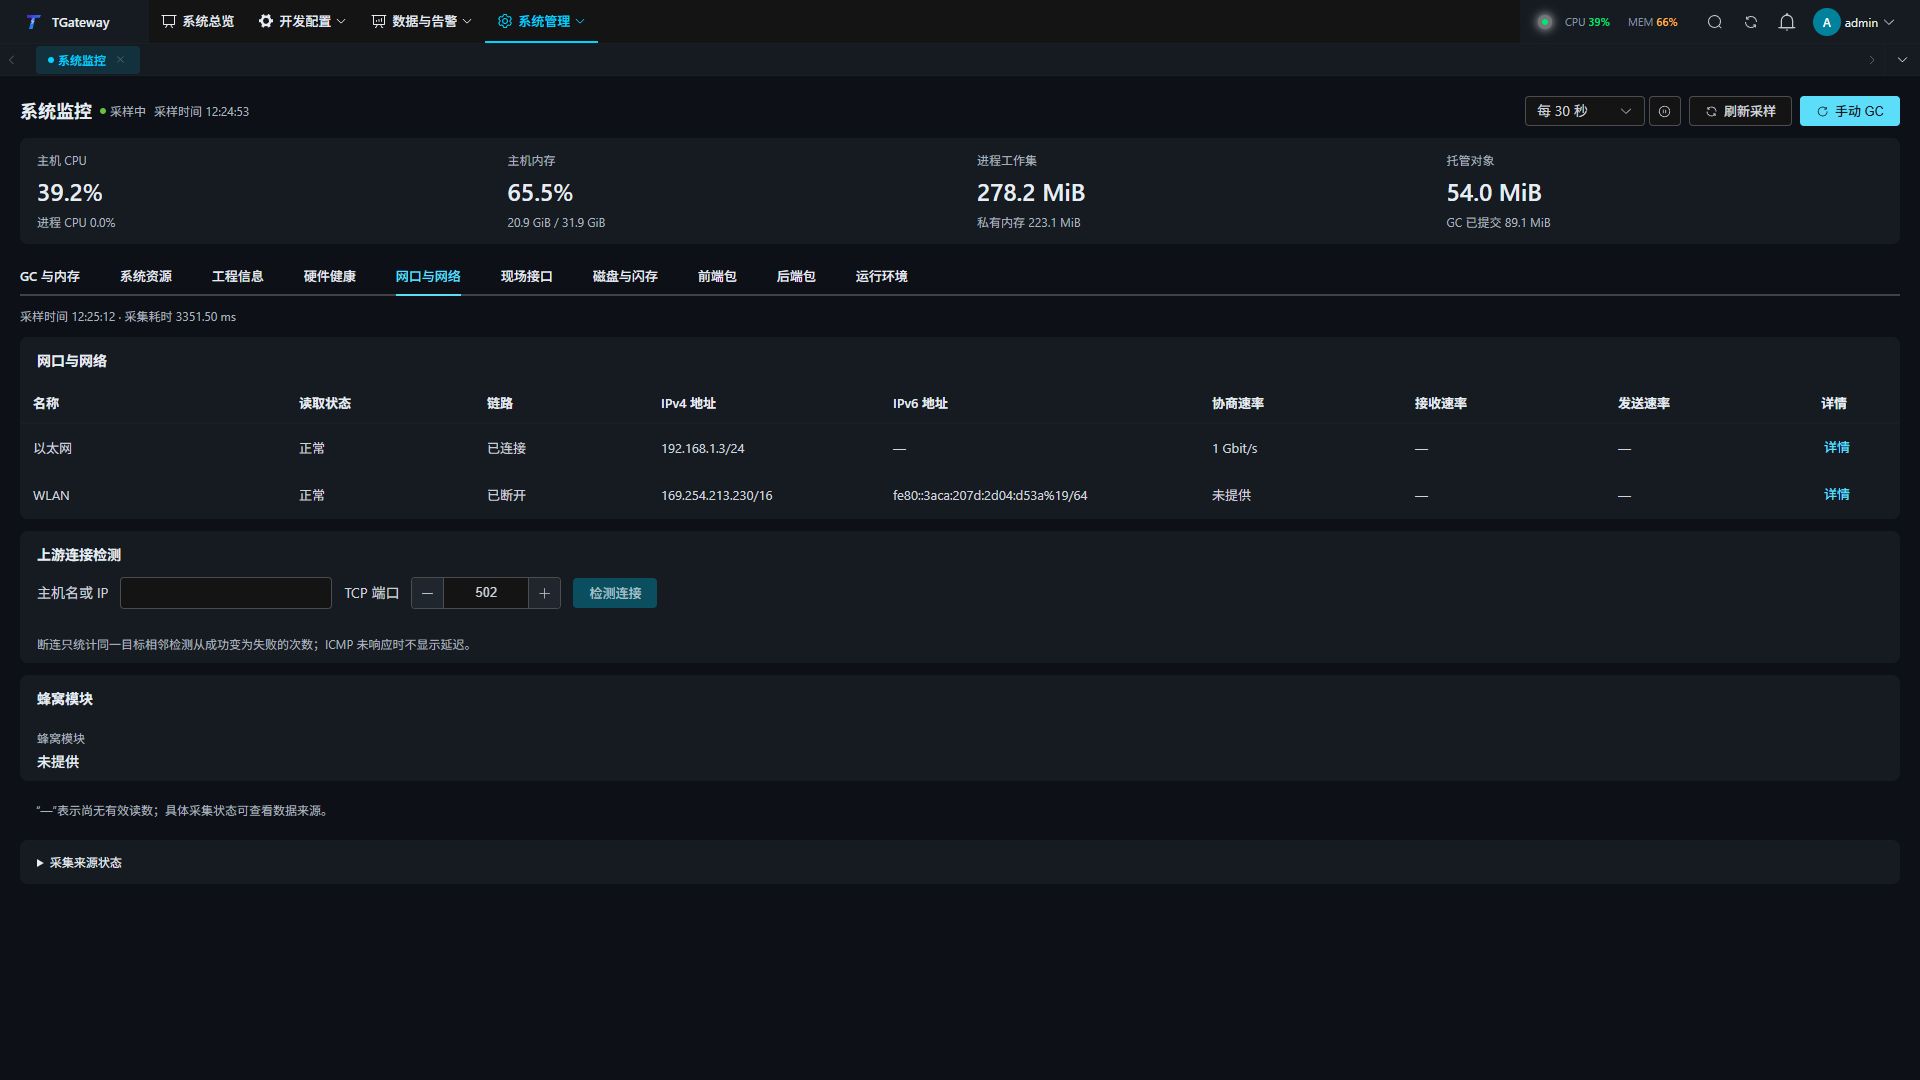
Observed disconnections count adjacent successful-to-failed checks for the same target, not all historical interface outages. Change addresses through System Settings.
If hardware, field-interface, or disk measurements are missing, check collector source status, then the operating system, device drivers, and runtime permissions.
Check packages and runtime environment
Open Frontend Packages or Backend Packages, search by name or version, and refresh the list to check releases and dependencies. File size, gzip reference size, and transferred bytes describe files and loading; use GC and Memory for memory usage. Frontend caching can reduce transferred bytes to zero; missing browser records display —.
Single-file publication, dynamic assemblies, or missing host dependency metadata can make some package fields unavailable. When troubleshooting, also record the actual .NET version, operating system, and architecture from Runtime Environment.
Run manual GC when needed
Manual GC requires its own permission. Blocking collection and compaction can pause execution; use a permitted maintenance window. Investigate workload and memory sources before using GC for sustained high usage.
- Open Manual GC and choose an optimized or forced mode and generation range.
- Select blocking collection, heap compaction, or LOH compaction as required.
- Click Run GC, review the confirmation, and submit.
- Compare managed objects, collection counts, call duration, and actual pauses. Wait for the displayed cooldown before another request.
Optimized collection can be skipped, and a nonblocking request can return before completion. Referenced objects remain, and the working set may not decrease immediately.
Troubleshooting
| Symptom | Check |
|---|---|
| Refresh does not change the sample time | 30-second sample reuse, pause state, and request errors. |
| Working set is much larger than managed objects | Mappings, shared pages, native allocations, and container cache, each in its own scope. |
| Container and host usage differ | Control-group limits, included processes, and host-wide measurements. |
| Manual GC or package data is missing | The corresponding viewing, package, and GC permissions. |
| Port check succeeds but collection or upload fails | Protocol, certificates, credentials, and device or target logs. |