On this page
Data Query
Open Data and Alerts → Data Query to view saved current values, historical records, and trends. This page reads a storage target; it does not read the PLC again. For newly collected values, use Collection Configuration.
Configure a real-time or historical storage target first. Its forwarding group must contain the required variables, and the target must have written records.
Query historical data
- Open the Historical Data tab.
- Select the target that stores these records. Options use group name/target name.
- For standard history, choose numeric or string data. Use numeric data for points such as temperature and pressure.
- Open the time-range panel, select the start date/time and end date/time, then confirm the panel. The range must include the actual samples.
- Search by variable name in Variable ID and select the result; you do not need to memorize the ID.
- Click Refresh and check the variable, value, and collection time.
If no target is available, create and save a historical target in Data Forwarding. If a target has no records, check that it has written data before changing the query filters.
View a trend
Query one numeric variable, then switch to Chart. Change the time range and refresh to view another period. Standard historical targets provide this view; custom SQL targets display their actual columns without the same variable trend chart.
Export query results
- Select the target, variables, and time range, then refresh and check the results.
- Choose the page size and page to export. One export contains the current page, rather than all records in the time range.
- Click the filter bar’s downward-arrow Export action and wait for the Excel file. The chart’s image-download action does not export records.
- Open the file and check variables, values, and collection times. Change pages and export separately when other pages are required.
The pagination total is the number of matching records, not the number of rows in this file. Column settings change the page display without removing other exported fields.
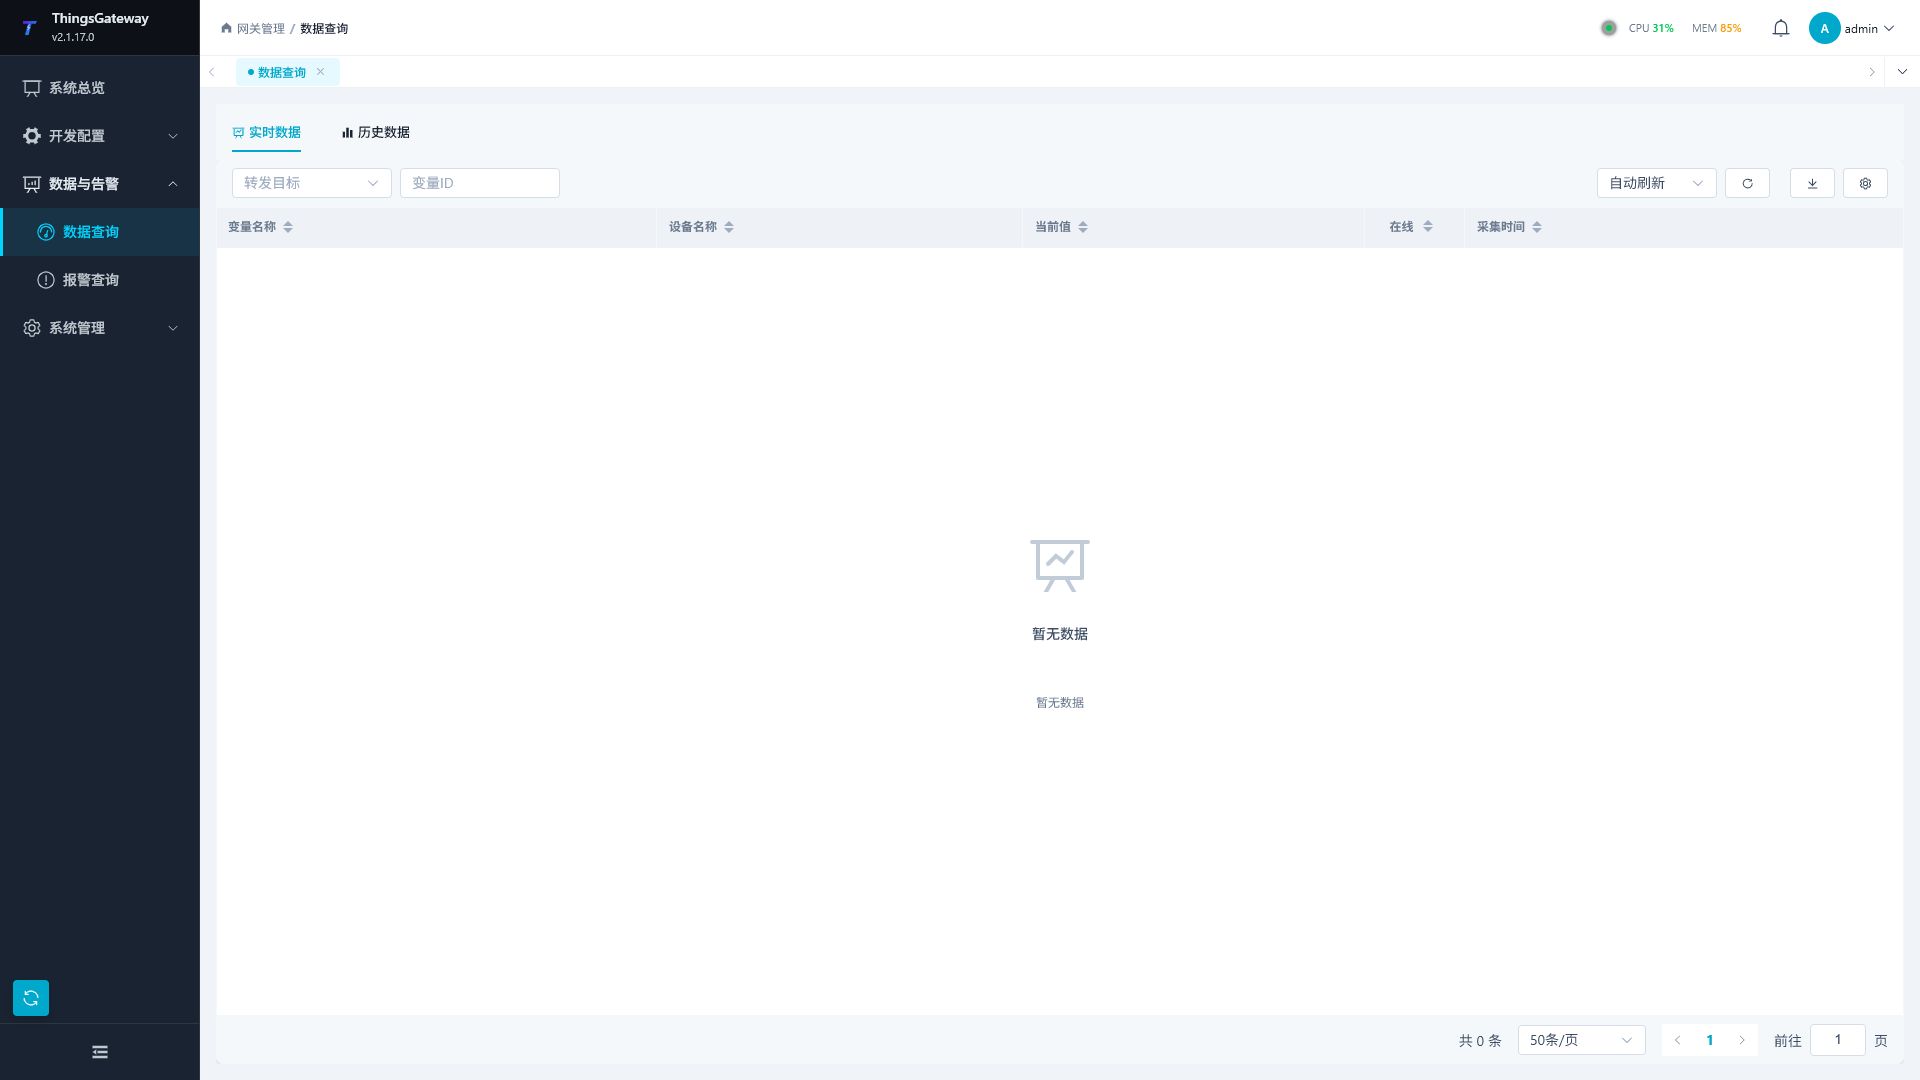
Query fields and controls
Real-time Data
Open Real-time Data, select the real-time storage target and optional variables, then refresh. Enable automatic refresh for continued observation. Pausing it freezes this page’s display. If collection values change but stored values do not, check the target and group membership.
Filters and tools
| Control | Description |
|---|---|
| Forwarding target | Select real-time data target. Targets come from real-time data targets in data forwarding. |
| Variable ID | Multi-selection filtering by variable ID, supports remote variable search. |
| Auto-Refresh | After activation, data refreshes at set intervals, allowing pause or resume. |
| Refresh | Immediately reload data under the current query conditions. |
| Export | Export real-time data under the current query conditions. |
| Column Settings | Control Table Column Display. |
Real-time data columns
| Column | Description |
|---|---|
| Variable Name | Variable Name. |
| Device Name | The device name to which the variable belongs. |
| Variable ID | Unique variable ID. |
| Current Value | The current value saved in the target. |
| Online | Quality saved with this record, which does not prove the device is online now. |
| Collection Time | Variable collection time. |
| Update Time | Real-time data target recording update time. |
Historical Data
The Historical Data tab queries numeric values, strings, or custom SQL wide-table records.
Database Modes
The columns shown by a historical target depend on its database and physical model. Standard history tables use the common variable fields; custom SQL targets display the columns returned by the actual database table.
| Database/mode | Query path | Typical columns | Custom SQL |
|---|---|---|---|
| SQL Server, MySQL, PostgreSQL, SQLite standard | Numeric or string history table | Device, variable, variable ID, value, collection time, online, record time, source epoch, source sequence, source node, and record key | - |
| SQL Server, MySQL, PostgreSQL, SQLite custom | Relational wide-table paging | Defined by template Columns | Supported |
| QuestDB standard | Native REST SQL | The common history fields | - |
| QuestDB custom | Native SQL wide table | Defined by template columns | Supported |
| TDengine standard | Native/WebSocket query | The common history fields | - |
| TDengine custom | Native SQL wide-table query | Defined by template columns | Supported |
| IoTDB Tree | Device-path and measurement query | The common history fields | Not supported |
| IoTDB Table standard | TIME, TAG, and FIELD table query | The common history fields | - |
| IoTDB Table custom | Table-model SQL/Tablet query | Defined by template columns | Supported |
IoTDB Tree and Table are mutually exclusive physical models. Tree targets do not show the Custom SQL option; choose Table when a wide-table schema or custom statements are required.
Filters and tools
| Control | Description |
|---|---|
| Forwarding target | Select a historical data target or custom SQL target. |
| Data type | A standard historical data target can query numeric or string data. |
| Time Range | Select the query start and end times. |
| Variable ID | Multi-select filter by variable ID. Custom SQL targets do not display this filter. |
| Refresh | Reload historical data. |
| Export | Export historical data under the current query conditions. |
| Column settings | A standard historical data target can control the displayed columns. |
Historical data columns
| Column | Description |
|---|---|
| Table | View history in a table. |
| Chart | A standard historical data target can switch to chart view for trend curves. |
| Device Name | The device name to which the variable belongs. |
| Variable Name | Variable Name. |
| Variable ID | Unique variable ID. |
| Value | Historical record value. |
| Collection Time | Variable collection time. |
| Online | The online status corresponding to the history. |
| Creation time | History writing time. |
| Custom columns | A custom SQL target displays the target table’s columns dynamically. |
Count, Sorting, and Paging
50 items/pageis only the current page size. TheTotal Nindicator is the database count under the current filters.- Standard mode stores one row per variable. Two variables in one cycle normally produce two rows; a custom wide table normally produces one grouped row, so totals are not expected to match mechanically.
- Sorting belongs to the current target. Switching targets clears the previous sort field and table sort state, so
createTimeis never sent to a wide table that only hasevent_timeortime. - To inspect the newest write, sort standard history by Record time descending. To inspect collection changes, sort by Collection time descending. Custom wide tables sort by their template time column descending.
- Paging is executed globally by the server. Cross-table count, sorting, distinct, and paging are not independently truncated per physical split table.
Time Zones
Time values fall into two categories: target storage wall-clock values and native UTC values.
| Data type | Display rule |
|---|---|
| SQL Server, MySQL, PostgreSQL, SQLite, and TDengine standard/custom | Stored and displayed using the target Time-zone offset, for example +08:00 displays 17:42. |
| IoTDB and QuestDB standard | Native UTC is projected to the target time zone by the server; a +08:00 target displays 09:42Z as 17:42. |
| IoTDB and QuestDB wide tables | The Z suffix is retained to make UTC explicit. Do not add eight hours manually. |
If collection time and record time differ substantially, check the sampling strategy, batch writing, and target time-zone configuration, then inspect the database’s raw time column. The query page does not guess the meaning of an offset-free string from the browser time zone.
Verify the results
| Query | Pass standard |
|---|---|
| Real-time data | The target, variable ID, current value, online state, and collection time match the same variable in Collection Configuration. The update time continues to change after refresh. |
| Historical data | Records appear in the selected time range, collection times are in the expected order, and the table values match the trend chart. |
| Custom SQL | The page shows the target table’s actual columns, and key fields match the acceptance sample in the target database. |
| Export | The file opens and matches the current filters and current page’s records. |
Records appearing on the page only confirms that the target contains data. For acceptance, compare one known field value across the collection page, target storage, and query result.
Usage Notes
| Scenarios | Recommended |
|---|---|
| Target list is empty | First configure and enable a real-time or historical data target in “Development Configuration → Data Forwarding”. |
| No data on the page | Check whether the forwarding target is running, whether the variable range includes the target variable, and whether the time range is correct. |
| Real-time data does not refresh | Check whether automatic refresh is paused or manually refresh. |
| Historical data cannot be found | Confirm that historical data targets have been written to the data, and the query time range covers the collection time. |
| The count is only 50 | 50 items/page is the page size. Read the Total N indicator and check that no time range or variable filter is active. |
| Targets have different counts | Standard mode stores one row per variable while custom wide tables group values; compare the mode and sampling strategy before comparing totals. |
| The newest time does not move | Sort standard history by Record time descending. If the count grows while time is unchanged, inspect target and SQL logs for a query ordered by a fixed collection time. |
| The time is eight hours off | Check the target Time-zone offset and whether the database value ends in Z. A Z value is already UTC and must not be converted twice. |
| Charts do not show | Charts are only applicable to general historical data targets; Custom SQL targets display only dynamic tables. |
| Large data output | Narrow the time range or variable range to avoid exporting too many records at once. |
Troubleshooting
| Phenomenon | Handling Recommendations |
|---|---|
| Forwarding Target Dropdown Empty | Check whether the data forwarding target type is real-time, historical, or custom SQL, and confirm that the target has been saved. |
| Variable ID cannot be found in search | Confirms the variable exists and that the current user has permission to view it. |
| Online state is unexpected | Return to “Collection Configuration” or “Memory Calculation” to view the variable status and error message. |
| Historical curve breakpoints | Check variable collection cycles, historical data sampling strategies, network status, and target cache. |
| Export failure | Narrow the query range and retry, then check the background logs in the system logs. |
Related Links
- Collection Configuration - View Real-Time Running Status of Variables
- Memory Calculation - Query Running Values of Memory Variables
- Data Forwarding - Configure Real-Time Data, Historical data and custom SQL targets
- Alarm Query - Queries real-time and historical alarms