On this page
System Overview
Open System Overview to inspect collection devices, variables, alarms and forwarding targets, then use the connection topology to locate the current gateway and its connected objects. Wait for loading to finish and compare successive samples before judging the current state.
Inspect the running gateway
First Look at Terms
| Terms | On-site Understanding |
|---|---|
| Channels | Communication links from gateways to field devices, such as a TCP connection, a serial port, or a listening port. |
| Device | a PLC, instrument, acquisition module, or a logic acquisition object managed by plugins. |
| Variable | A point in the point list, such as temperature, pressure, operating status, fault state, or control write point. |
| Real-time alarms | Alarm events that still require attention. |
| CPU/memory/disk | gateway host resources. If the data remains high for a long time, prioritize checking collection frequency, forwarding cache, rule flow, and log volume. |
Page Entry
After signing in, open System Overview from the main navigation.
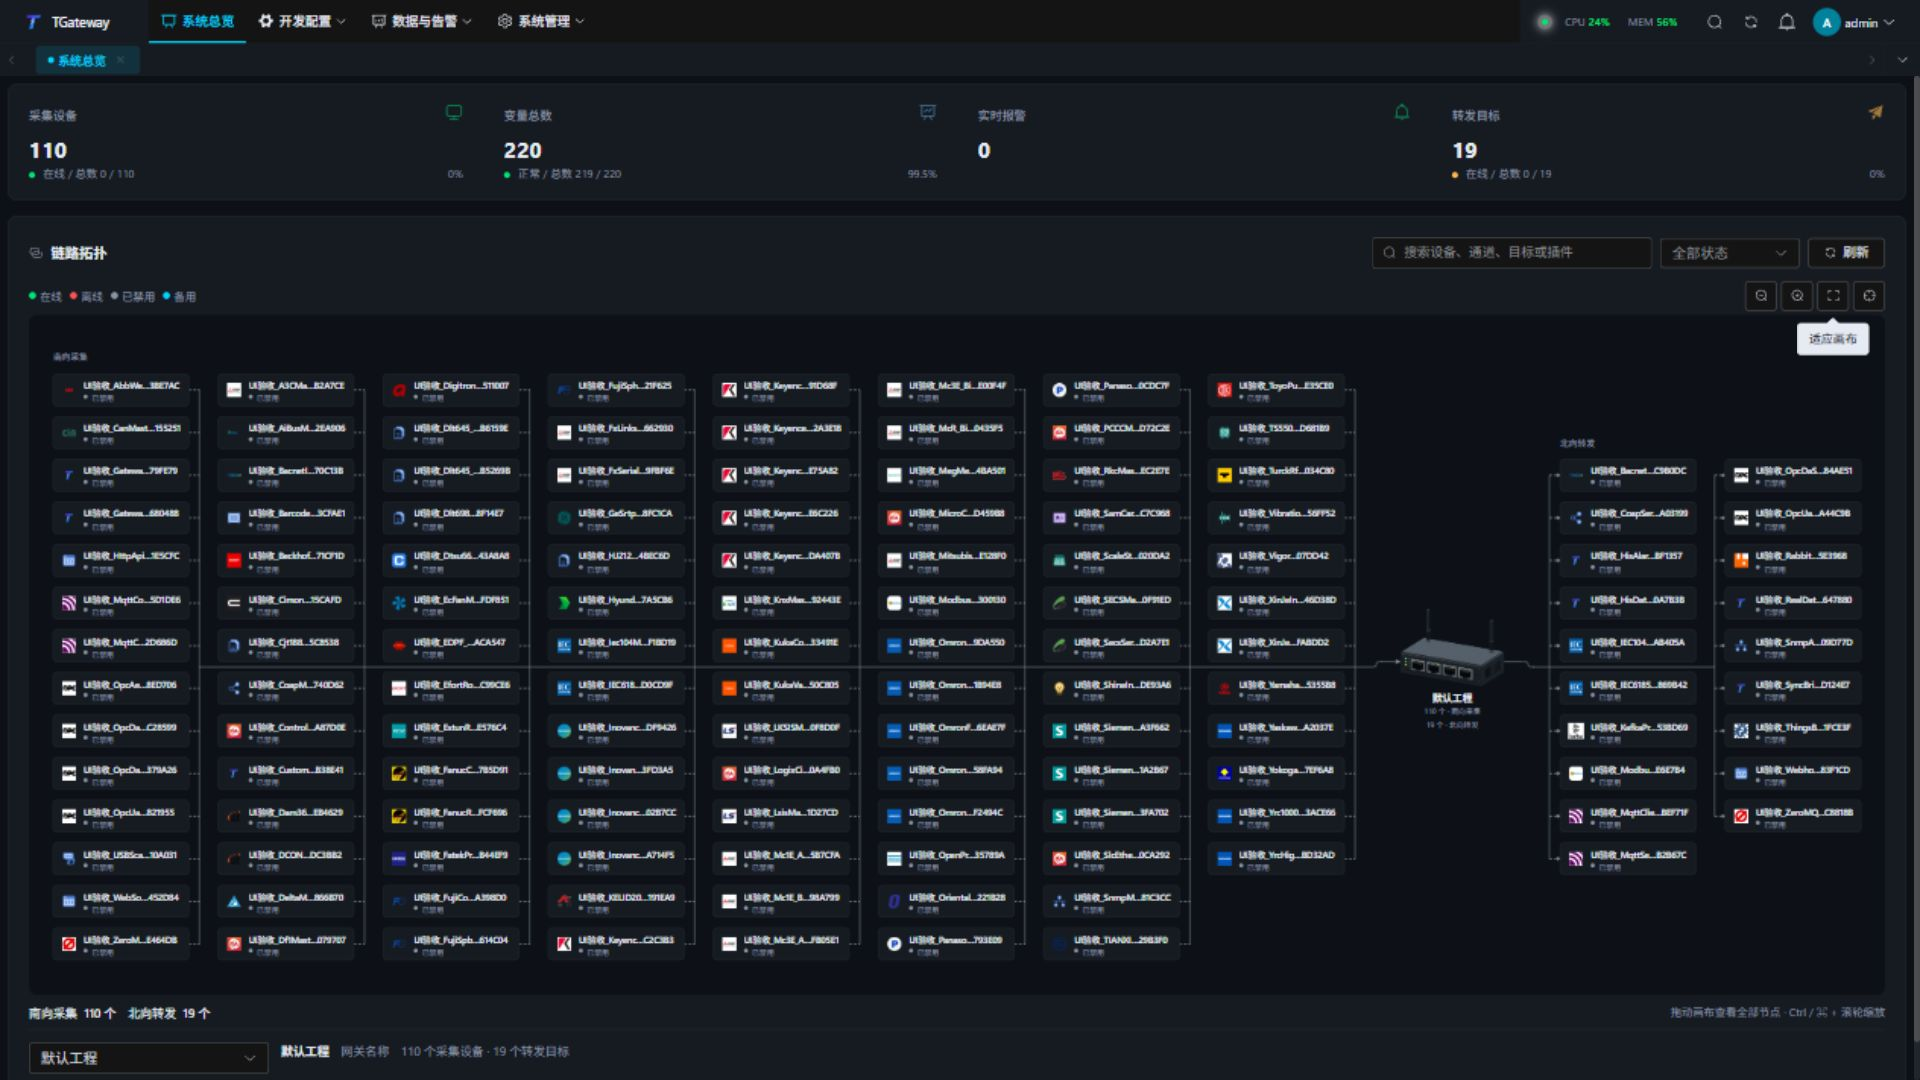
Statistics Card
| Card | Description |
|---|---|
| Collection devices | Compare the configured total with the online count. Inspect offline devices in Collection Configuration. |
| Total number of variables | Displays the total number of variables and indicates the number of normal variables. |
| Real-time Alarm | Shows alarm-variable and event counts requiring attention. |
| Forwarding targets | Compare total and online targets, then verify their actual output at the receiver. |
If statistics or sections are missing, check viewing permissions and loading state. — means data is unavailable or not yet loaded. A failed refresh can retain the last successful value, so check status and collection time. View channel counts in Collection Configuration → Channel Management.
Variable totals can include memory variables and automatically created status variables. Compare configured totals, licensed capacity, and currently online/healthy counts separately; they do not have to equal the PLC point-table row count.
Check collection readings
- Open a known collection point and compare its value, raw value, quality, and advancing collection time with the source.
- Check the associated device plugin, execution interval, and channel endpoint, then test the actual protocol address.
- In a permitted test environment, stop the source and inspect device and variable offline states and the last collection time.
- Restart the same source without recreating the channel, device, or variable. Verify restored quality and advancing time.
- If forwarding is configured, verify a new message at an independent receiver. See Collection debugging.
Page Layout
The overview shows business statistics and the connection topology, with sections adapting to the available width. Open System Management for project settings and System Monitor for process, memory, and hardware diagnostics.
Link topology
The canvas connects southbound collection devices, the gateway, and northbound forwarding targets.
- Search by device, channel, target, or plugin name and optionally filter online, offline, disabled, or standby objects.
- Drag the canvas and use zoom, fit, or gateway-location controls. Ctrl / Command plus the wheel also zooms.
- Select a node on the canvas or in the node selector. Check its identity and actual runtime state, then inspect configuration or logs.
- Clear search and state filters and refresh to check the complete permitted scope.
The topology includes only objects the account may view. If an object is missing, check viewing permissions, search terms, and state filters.
Inspect project details
Open System Management → System Settings to inspect the loaded project and gateway settings. Check the software version, gateway identity, and licensed resource limits in their corresponding system or licensing pages. These details are separate from the overview’s online counts.
Monitor system resources
System Resource Monitoring
Open System Management → System Monitor for process, thread-pool, GC, and memory trends. Overview summaries depend on the layout; use System Monitoring and Memory Analysis for detailed measurements and operations.
| Metrics | Description |
|---|---|
| CPU Usage | System CPU Usage Percentage. If the rate remains high, prioritize high-frequency collection, rule processes, and data forwarding. |
| Memory usage | System memory usage percentage. If persistently high, check the number of variables, cache queues, and runlogs. |
| Disk Usage | Used and total capacity of the disk containing the gateway program. Insufficient space can affect history, cache files, and logs. |
| Process memory, GC memory | The gateway process working set and managed memory. |
| System disks | Combined capacity of all fixed host disks. Check the individual storage disk as well. |
| Runtime | Host-system uptime. View gateway process uptime in System Monitor. |
| Network Interface | displays the network card name and IP address to confirm the current access address and on-site network configuration. |
When disk usage approaches its limit, identify files before cleanup. Preserve active databases, WAL files, and cache records awaiting replay.
Trend Chart
Open System Monitor for recent changes in host CPU, system memory and network upload/download speed. Host traffic can include other applications and protocol overhead, so it does not directly measure point throughput.
| Chart | Explanation |
|---|---|
| CPU Trends | View CPU Usage Changes, Used to determine whether there is a sustained high load. |
| Memory Trends | View changes in memory usage to determine if there is sustained growth. |
| Network Speed | View upload and download speeds, used to assess data forwarding or changes in external access traffic. |
These are host-resource trends. Use Data Query for point history. Capacity assessment requires a sustained observation window, device and variable counts, actual request rate, and enabled workloads; see Capacity planning.
Related Links
- Collection Configuration - Channel, Device, Variable Configuration
- Real-Time Alarm - Alarm Monitoring and Handling
- System Settings - Gateway System Configuration