On this page
Interface and workspaces
Use this page to identify the current component, adjust its appearance and navigate the workbench. For first sign-in, see Startup and first sign-in. Find feature guides in the documentation directory.
Identify the component
| Task | Component | Default Web port |
|---|---|---|
| Configure channels, devices, variables, rules, alarms and forwarding | TGateway | 6100 |
| Manage multiple sites and projects, deploy and retrieve projects, update remotely | Studio | 5100 |
| Check the site process, apply projects, inspect startup logs and restore backups | Watchdog | 6200 |
Watchdog and TGateway run on the same site machine in the same runtime environment, with separate login accounts. Studio can run independently. Opening a Studio project opens that project’s TGateway Web editor. Use the configured ports after any changes; the URL alone does not identify the active project.
Adjust theme and text contrast
Open Theme settings in the account menu at the upper right. The initial theme is dark, with automatic text contrast on primary-color backgrounds. Saved browser preferences take precedence. Restore defaults restores dark mode and automatic contrast.
Check text in tables, inputs, disabled controls and selected items after making a change. Theme settings affect display only; they do not change collection, forwarding or account permissions.
Choose the navigation layout
In the account menu, select Navigation layout → Top layout or Side layout. Top layout opens pages from menu groups; side layout uses the left navigation. Both expose the same menus and permissions. The preference is saved in the current browser and can be set separately in another browser.
If a menu is missing, check the account’s role and menu permissions, then confirm whether you signed in to TGateway, Studio or Watchdog.
Identify the collection workbench
Open Development Configuration → Collection Configuration, select a device on the left, then check its name, plugin and status at the top of the workbench. The variable list follows the selected scope. Check the debug target again after switching devices.
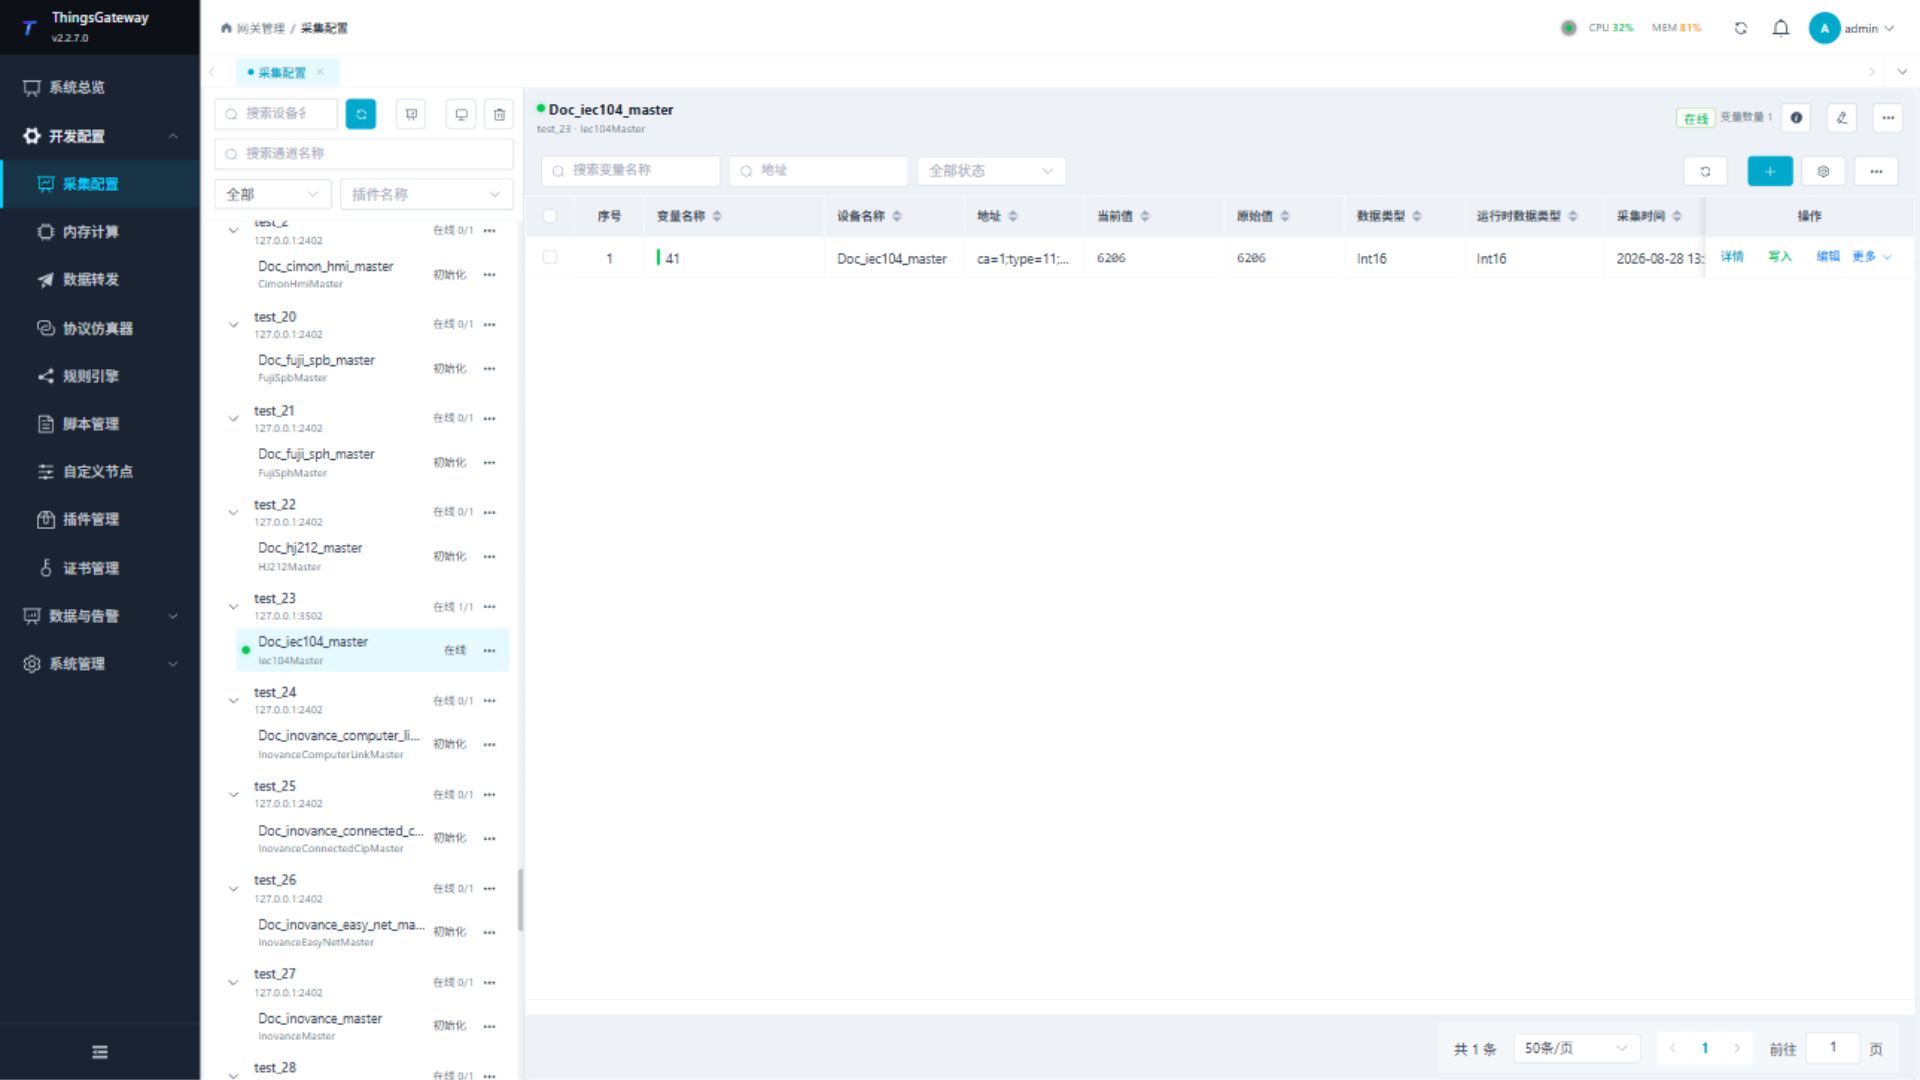
Real-time Variables, Details, Protocol Debug, Channel Logs and Device Logs all apply to the selected device. Placing the debug area below / to the right changes the workbench split and is saved separately from the global navigation layout. See Device details and debugging.
After changing theme or layout, confirm the selected device and variable scope before reading or writing. Creation, batch maintenance and parameter reference belong in Channels, devices and variables.